#30DayChartChallenge(@30DayChartChall) 's Twitter Profileg
#30DayChartChallenge

@30DayChartChall

A #DataViz challenge by @CedScherer and @dr_xeo
Supported by @ShijiaWendy and @_ansgar

🦋https://t.co/KXiiWoZFTf

📢 Join us during April!

ID:1363434675507707909

linkhttp://30DayChartChallenge.org calendar_today21-02-2021 10:25:36

6,3K Tweets

6,0K Followers

6,3K Following

Cédric Scherer(@CedScherer) 's Twitter Profile Photo

I am glad, I don't have to write a wrap-up blog post but have the great Lisa Charlotte Muth doing it for me 🙌

Check the post about my 'The Simpsons' x Datawrapper edition of the featuring some contributions and an interview on my experience and learnings!

account_circle
Natalia Kiseleva(@eolay13) 's Twitter Profile Photo


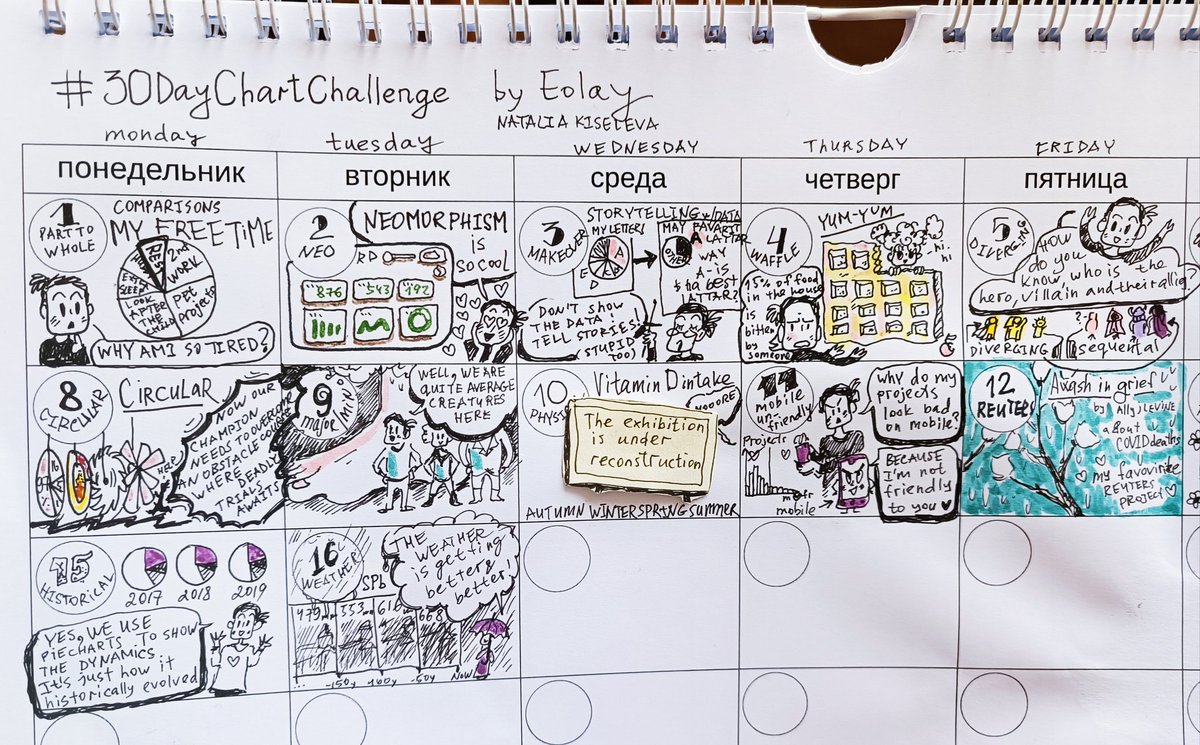
In St. Petersburg, the weather is like a parable, rainy, windy, and unstable! And yet, there was a feeling that it's getting warmer and the rains don't seem to be as frequent anymore...
No...
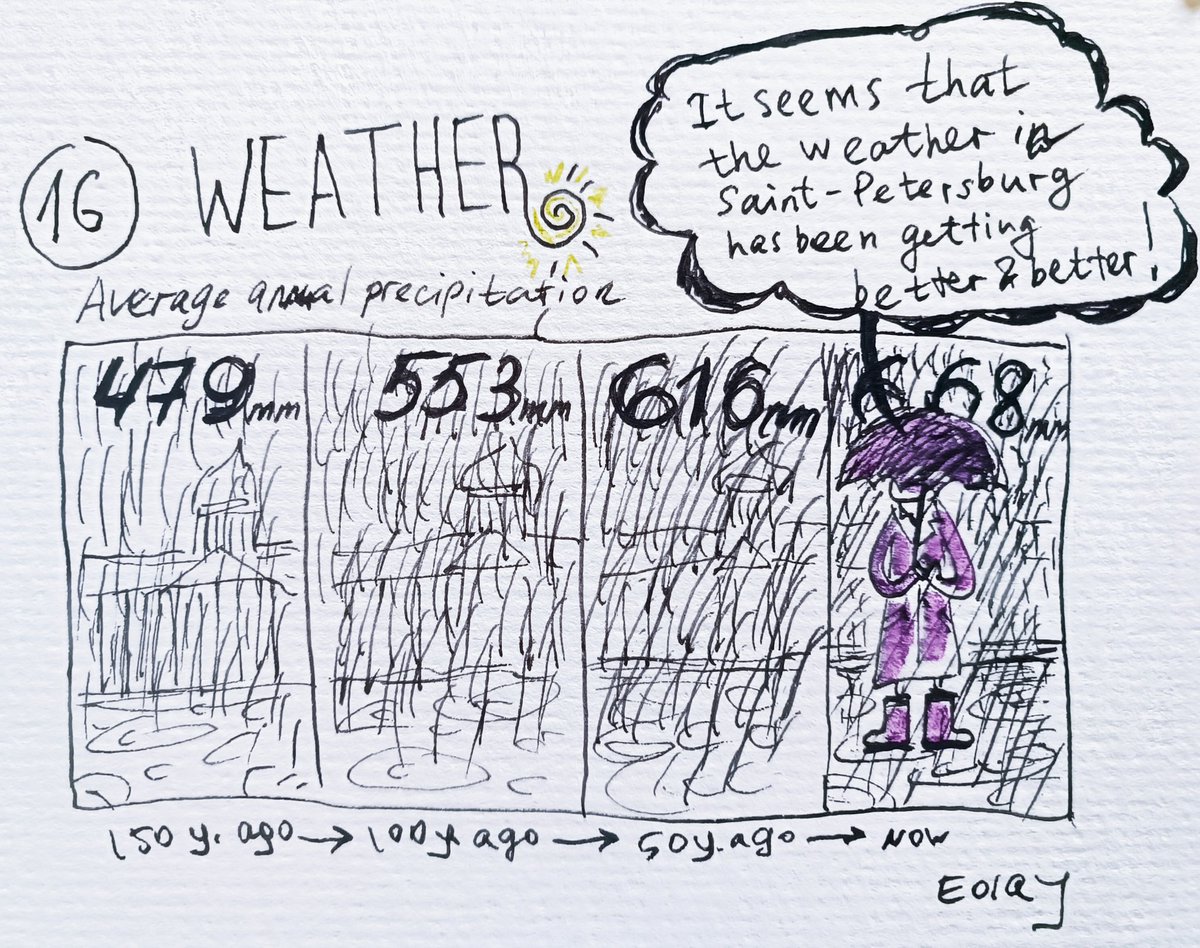
#30DayChartChallenge In St. Petersburg, the weather is like a parable, rainy, windy, and unstable! And yet, there was a feeling that it's getting warmer and the rains don't seem to be as frequent anymore... No...
account_circle
Cullen(@s_cullen99) 's Twitter Profile Photo


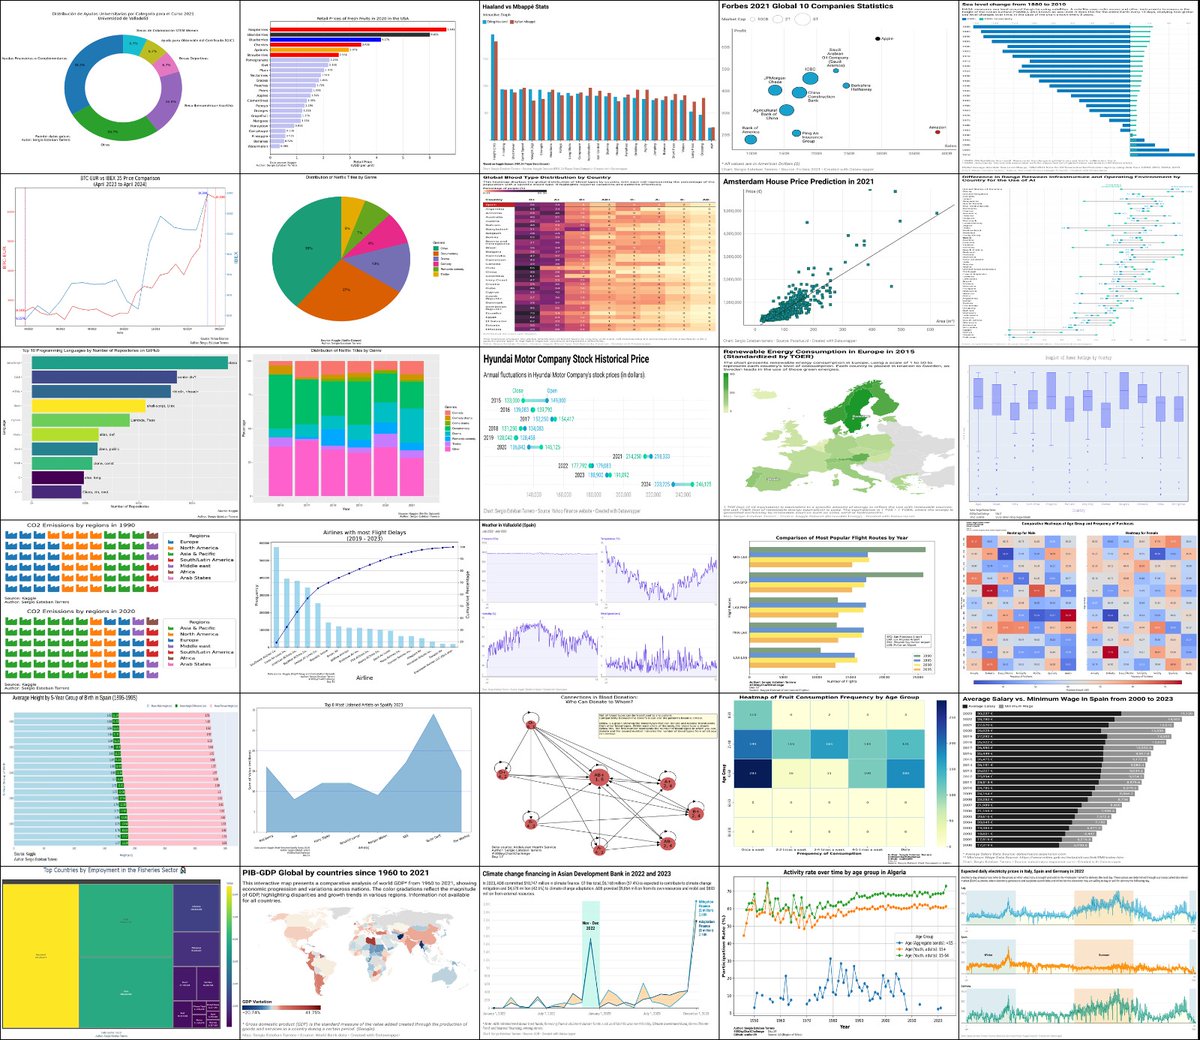
Day 21

Renewable Energy Consumption in Europe in 2015 🔋

Data Source: kaggle.com/datasets/imtka…
Interactive Chart: datawrapper.de/_/UueCi/
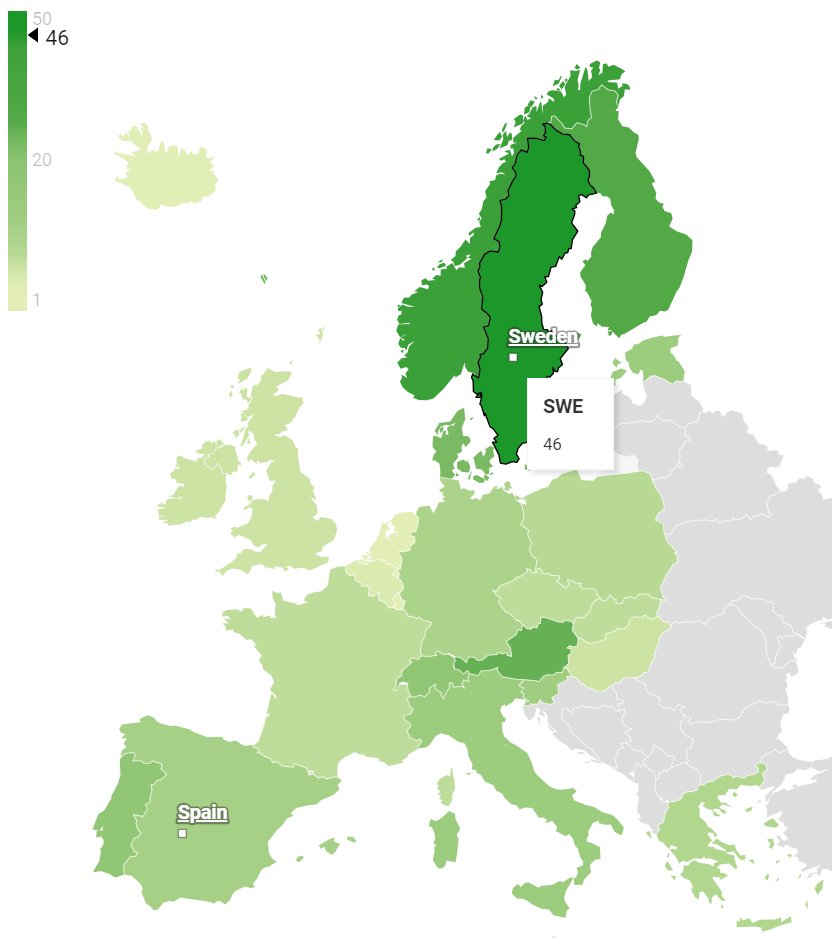
#30DayChartChallenge Day 21 Renewable Energy Consumption in Europe in 2015 🔋 Data Source: kaggle.com/datasets/imtka… Interactive Chart: datawrapper.de/_/UueCi/
account_circle
Cullen(@s_cullen99) 's Twitter Profile Photo


Day 22

Comparison of Most Popular Flight Routes by Year ✈️

Data Source: kaggle.com/datasets/juanr…
Github Repo: github.com/scullen99/30Da…
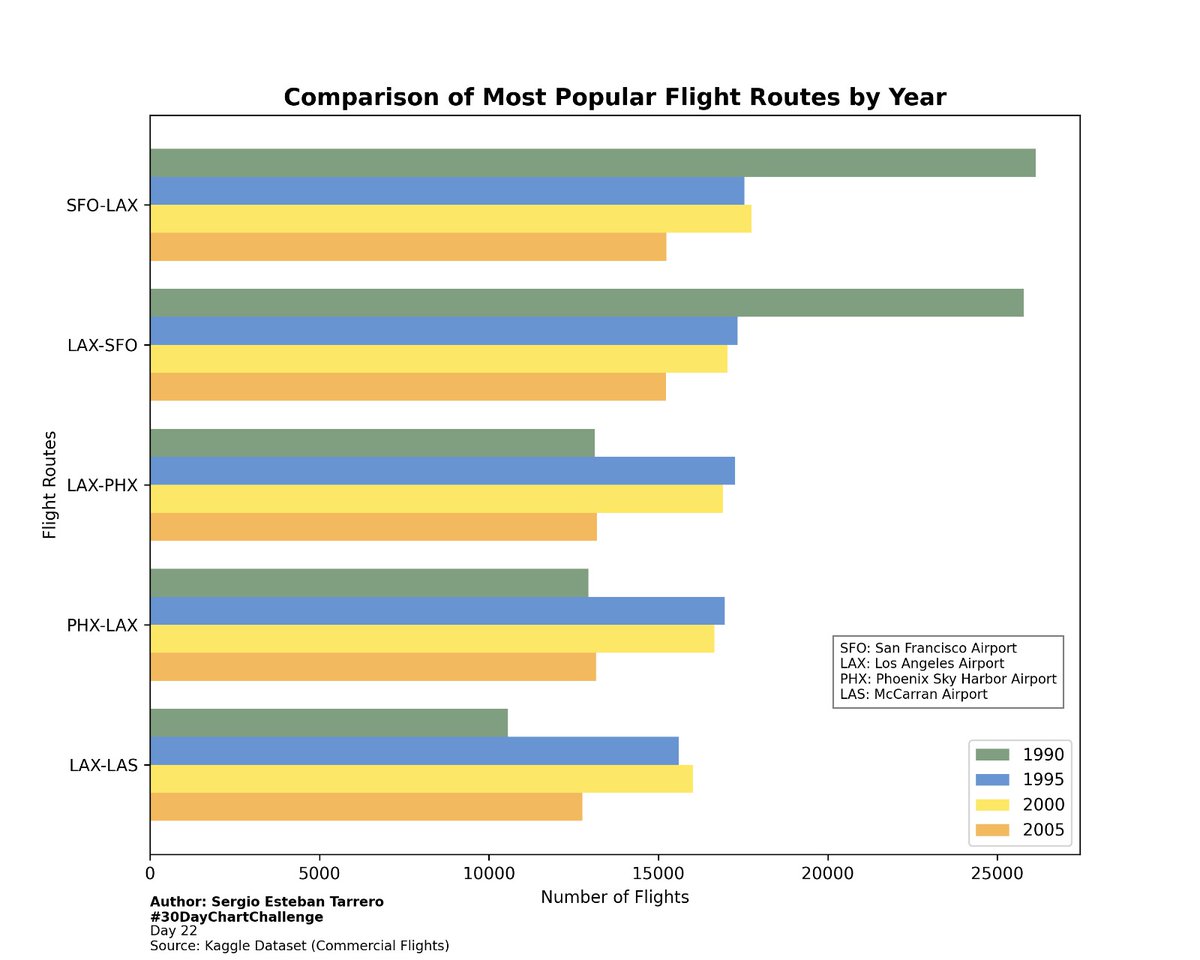
#30DayChartChallenge Day 22 Comparison of Most Popular Flight Routes by Year ✈️ Data Source: kaggle.com/datasets/juanr… Github Repo: github.com/scullen99/30Da…
account_circle
Cullen(@s_cullen99) 's Twitter Profile Photo


Day 18

Data Day - Asian Development Bank

Climate change financing in Asian Development Bank in 22 and 23🌡️

Data Source: data.adb.org/dataset/climat…
Datawrapper Chart: datawrapper.de/_/sauIg/
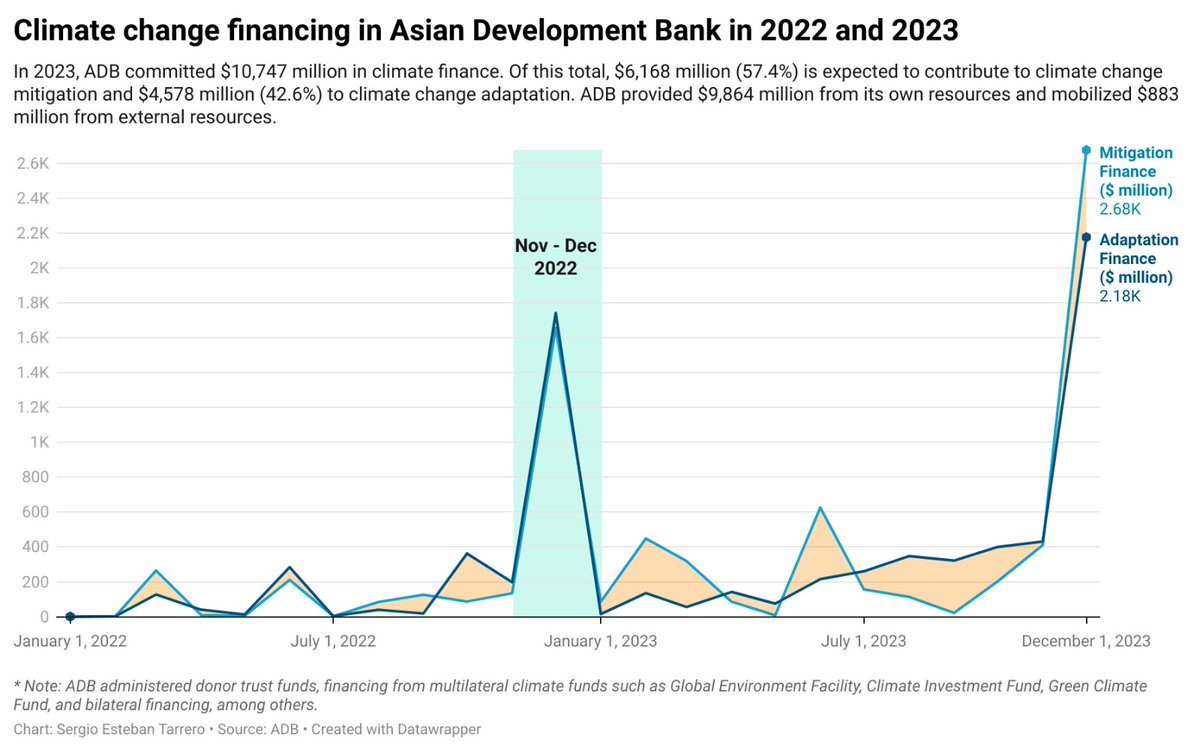
#30DayChartChallenge Day 18 Data Day - Asian Development Bank Climate change financing in Asian Development Bank in 22 and 23🌡️ Data Source: data.adb.org/dataset/climat… Datawrapper Chart: datawrapper.de/_/sauIg/
account_circle
Cullen(@s_cullen99) 's Twitter Profile Photo


Day 23

Heatmap of Fruit Consumption Frequency by Age Group 🍎🍐🍊🥝

Data Source: kaggle.com/datasets/zain2…
Github Repo: github.com/scullen99/30Da…
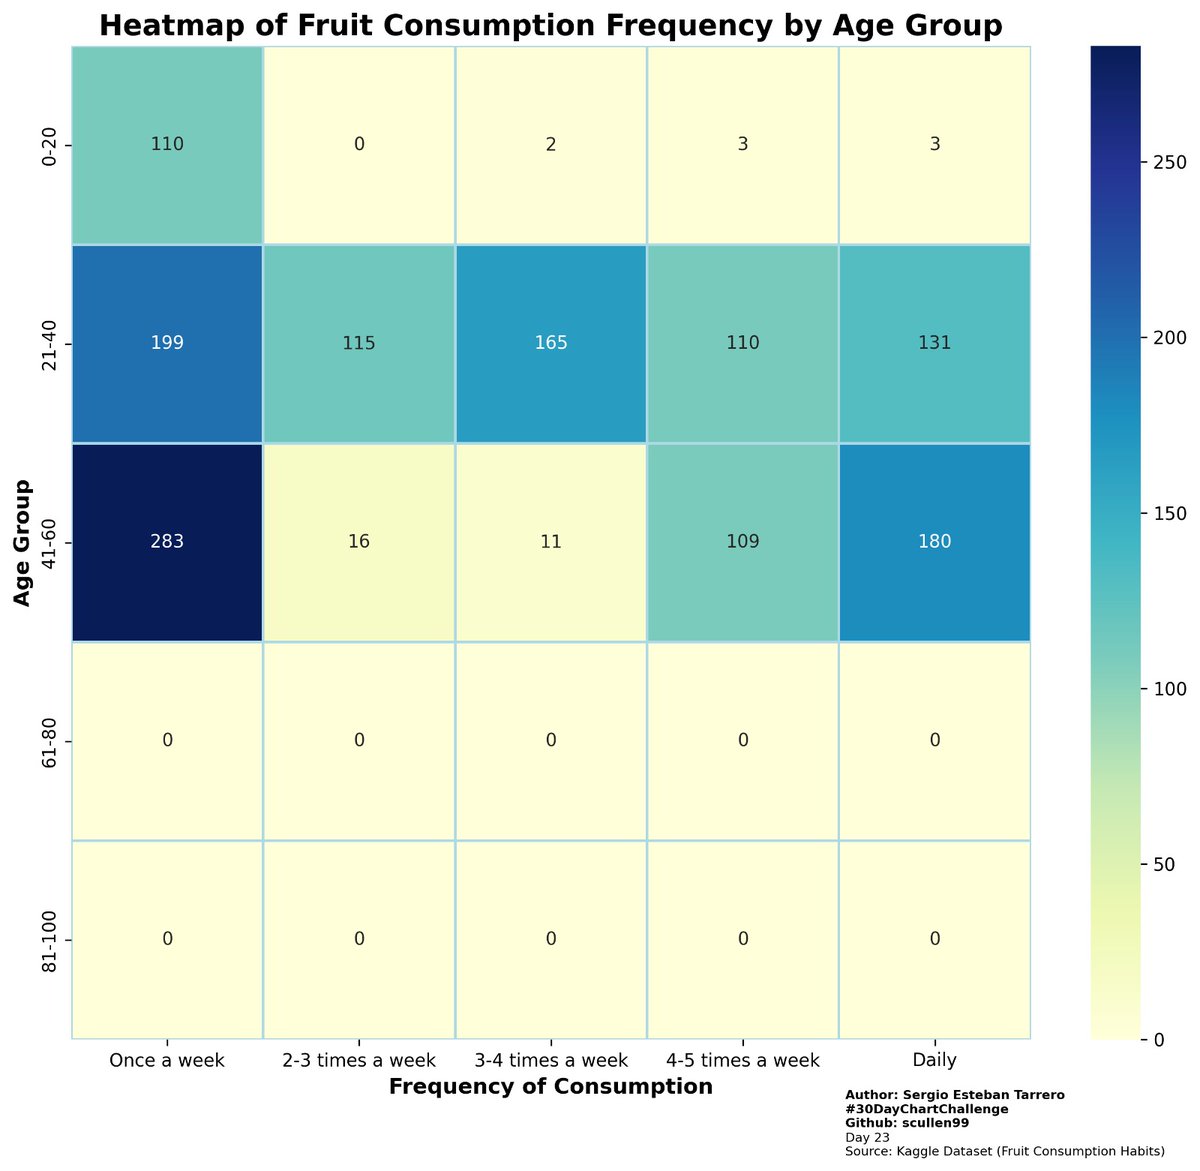
#30DayChartChallenge Day 23 Heatmap of Fruit Consumption Frequency by Age Group 🍎🍐🍊🥝 Data Source: kaggle.com/datasets/zain2… Github Repo: github.com/scullen99/30Da…
account_circle
Tan(@tangandhara) 's Twitter Profile Photo

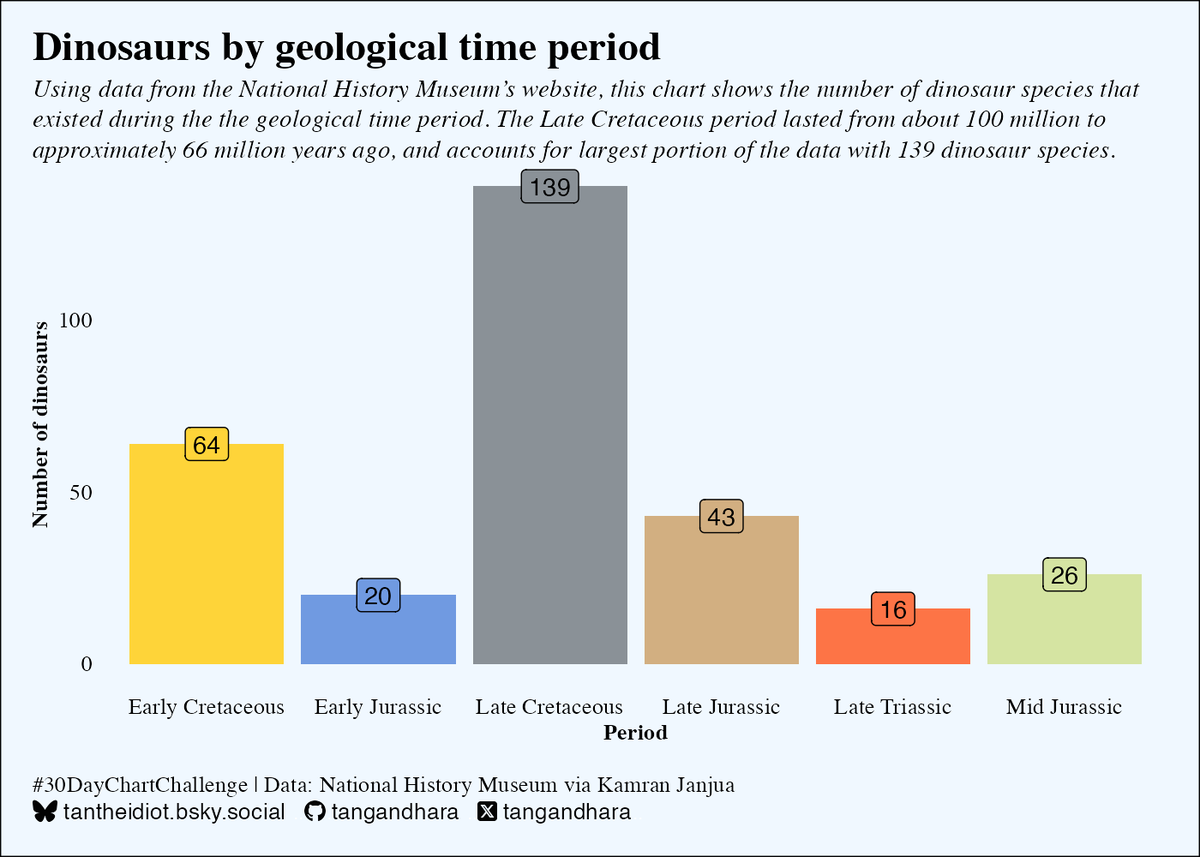
Day 19 of - dinosaurs.

How many dinosaur species in each geological period? This chart has the answers with data from the Natural History Museum's website.

Day 19 of #30DayChartchallenge - dinosaurs. How many dinosaur species in each geological period? This chart has the answers with data from the Natural History Museum's website. #dataviz #rstats #ggplot2
account_circle
Nadya Andrianova(@andria__nova) 's Twitter Profile Photo

Day 16. Let’s add a bit of burlesque to this snowy day in May. The year 2023, as you know, was the hottest on record in many countries, but not here; it was cool and cloudy for us. Each day is shown with two palettes — day and evening. Take a look at December

account_circle
Tan(@tangandhara) 's Twitter Profile Photo

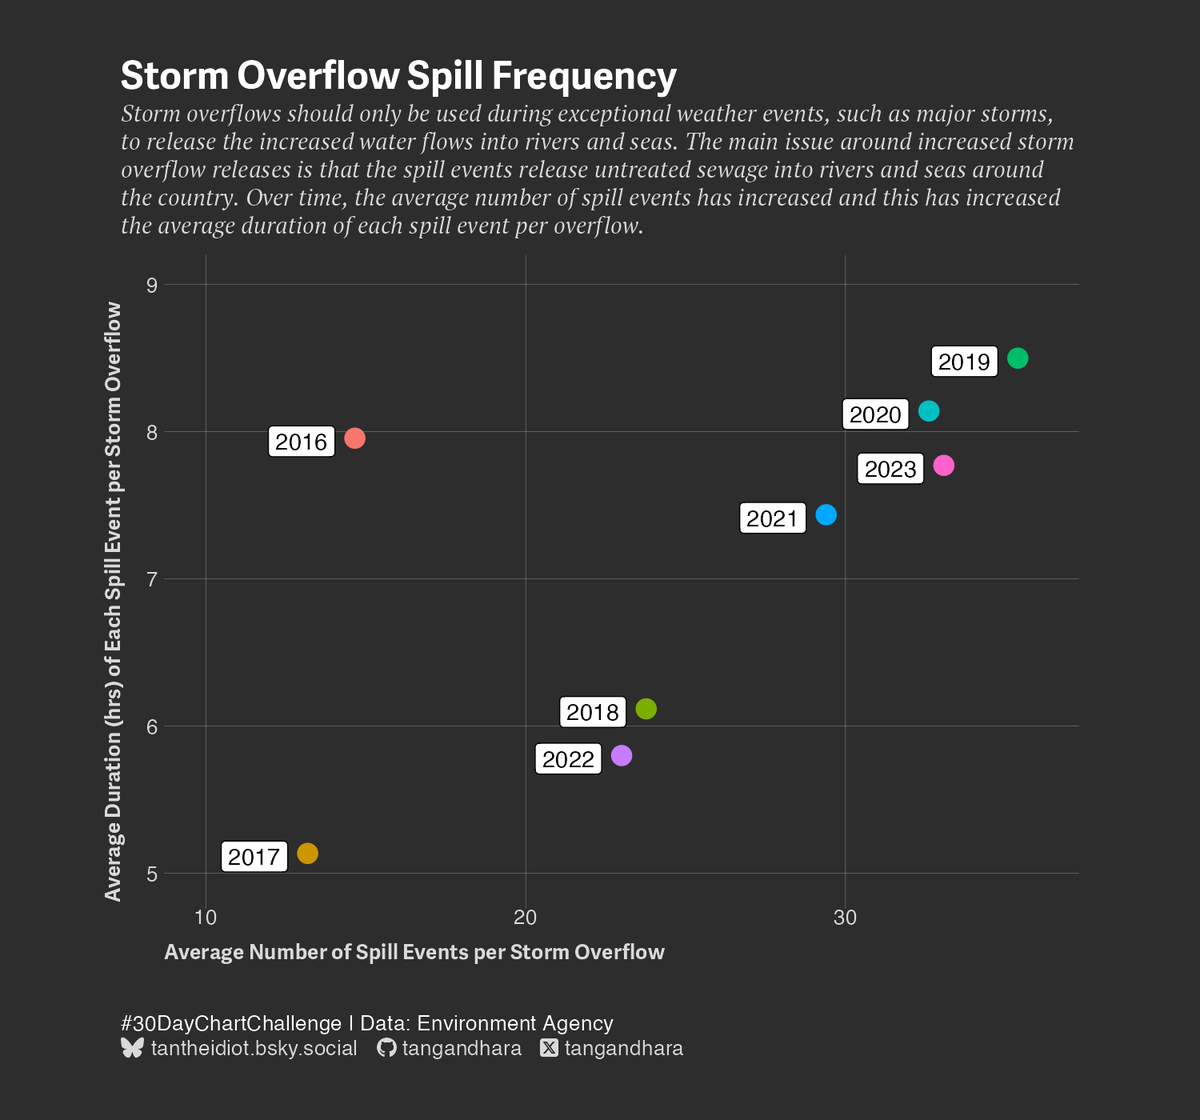
Day 20 of - correlation.

The plot looks at storm overflow spill frequency for England since 2016. As average number of spill events have increased over time, so has the duration in hours per event for each overflow.

Day 20 of #30DayChartChallenge - correlation. The plot looks at storm overflow spill frequency for England since 2016. As average number of spill events have increased over time, so has the duration in hours per event for each overflow. #dataviz #ggplot2 #rstats
account_circle
Cullen(@s_cullen99) 's Twitter Profile Photo


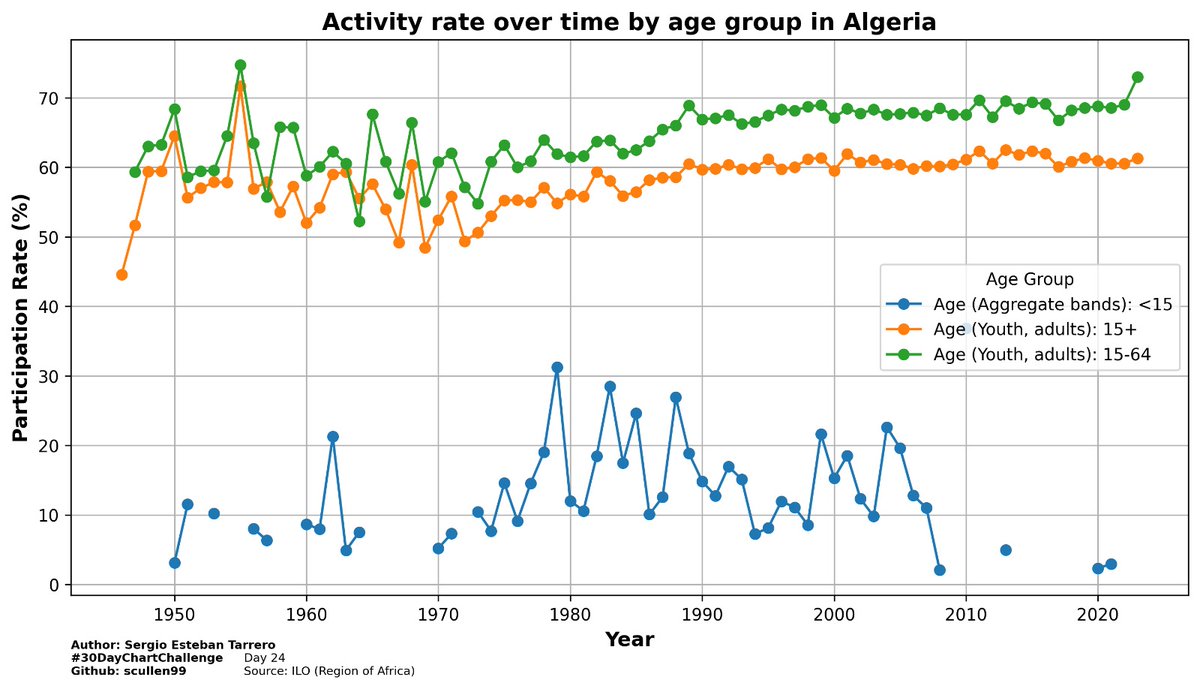
Day 24

ILO Region of Africa (Data Day)

Activity rate over time by age group in Algeria

Data Source: rshiny.ilo.org/dataexplorer12….
Github Repo: github.com/scullen99/30Da…

#30DayChartChallenge Day 24 ILO Region of Africa (Data Day) Activity rate over time by age group in Algeria Data Source: rshiny.ilo.org/dataexplorer12…. Github Repo: github.com/scullen99/30Da…
account_circle
Cullen(@s_cullen99) 's Twitter Profile Photo


Day 25

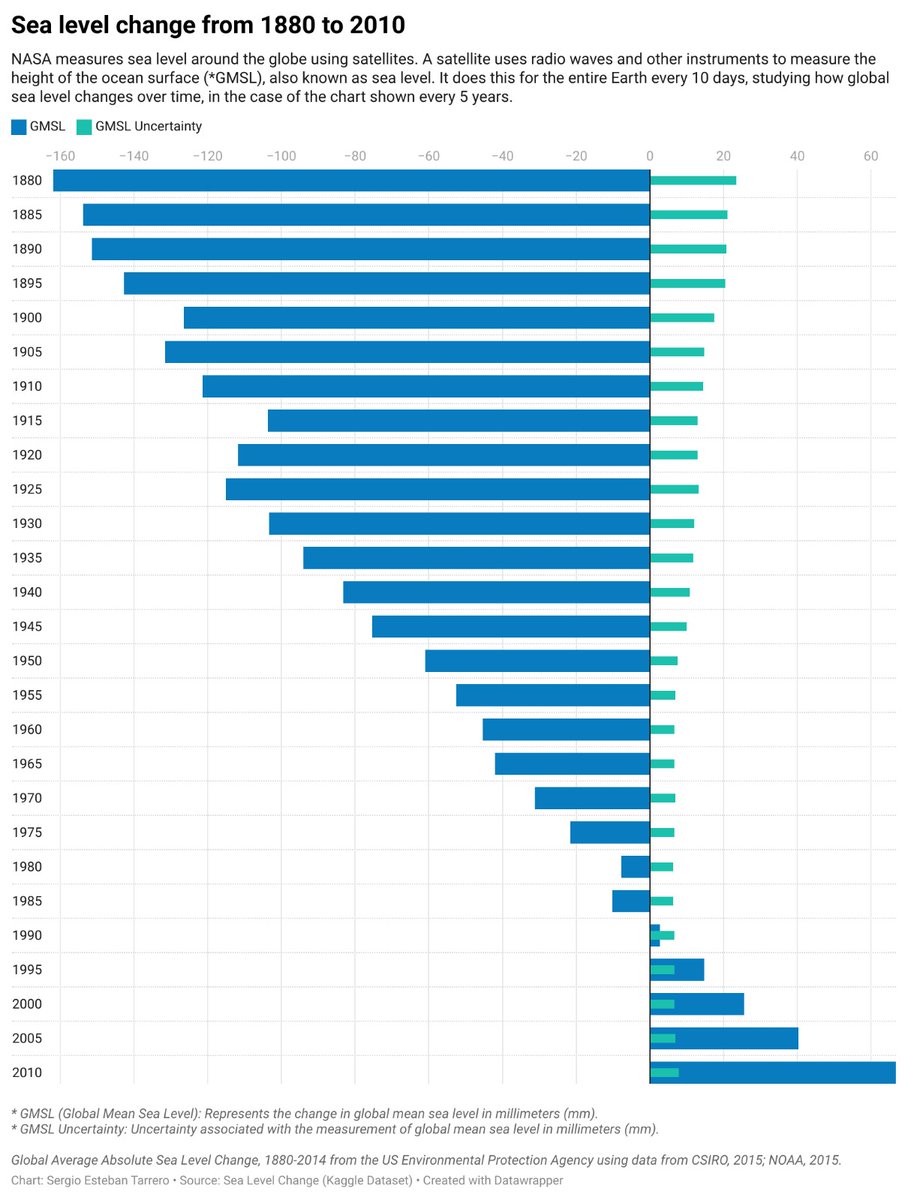
Sea level change from 1880 to 2010 🌊

Data Source: kaggle.com/datasets/somes…
Datawrapper Link: datawrapper.de/_/jYijL/?v=2
Github Repo: github.com/scullen99/30Da…

#30DayChartChallenge Day 25 Sea level change from 1880 to 2010 🌊 Data Source: kaggle.com/datasets/somes… Datawrapper Link: datawrapper.de/_/jYijL/?v=2 Github Repo: github.com/scullen99/30Da…
account_circle
Cullen(@s_cullen99) 's Twitter Profile Photo


Day 26

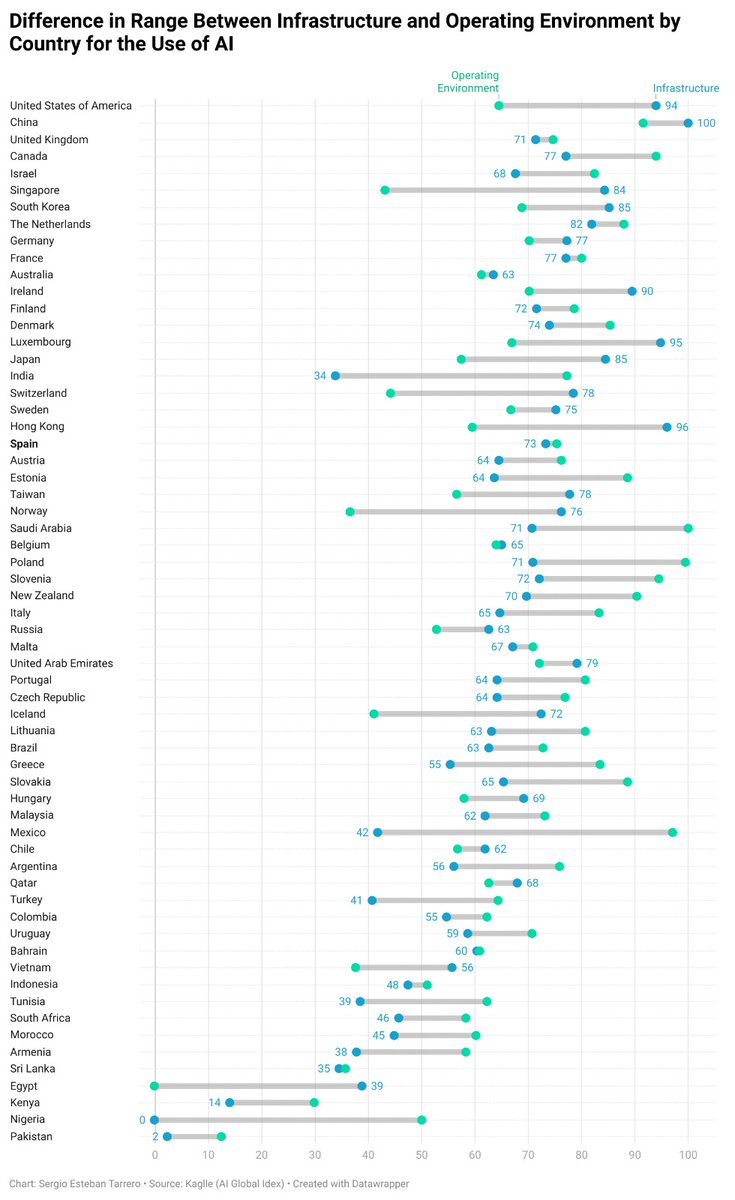
Difference in Range Between Infrastructure and Operating Environment by Country for the Use of AI 🤖

Data Source: kaggle.com/datasets/kater…
Datawrapper Link: datawrapper.de/_/yZZWe/
Github Repo: github.com/scullen99/30Da…

#30DayChartChallenge Day 26 Difference in Range Between Infrastructure and Operating Environment by Country for the Use of AI 🤖 Data Source: kaggle.com/datasets/kater… Datawrapper Link: datawrapper.de/_/yZZWe/ Github Repo: github.com/scullen99/30Da…
account_circle
Cullen(@s_cullen99) 's Twitter Profile Photo


Day 27

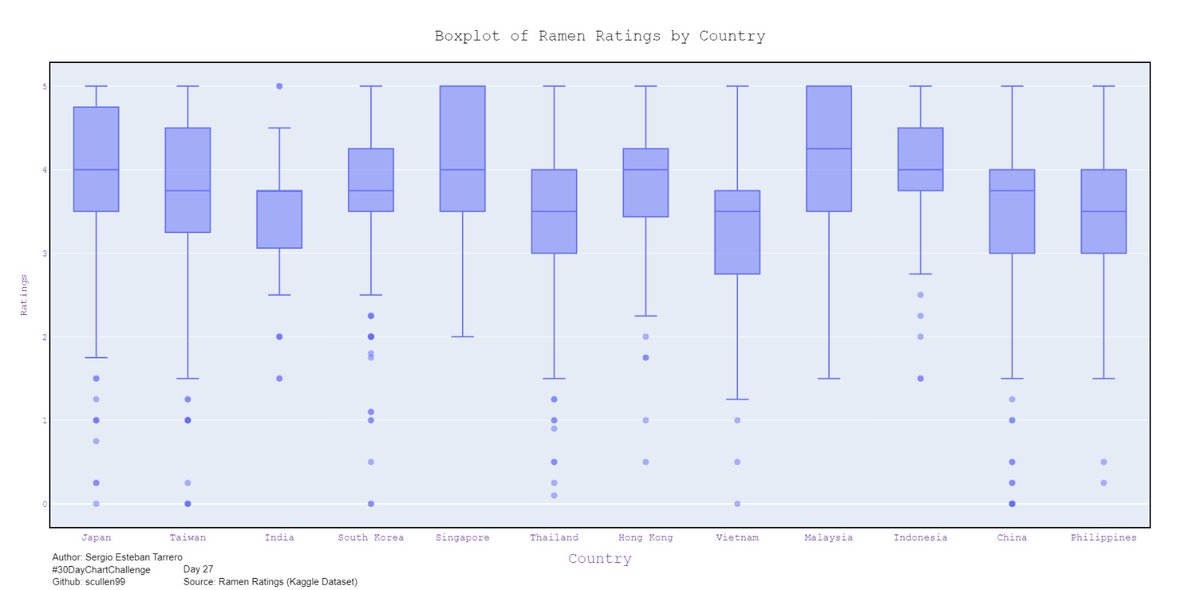
Boxplot of Ramen Ratings by Country 🍜

Data Source: kaggle.com/datasets/resid…
Github Repo: github.com/scullen99/30Da…

#30DayChartChallenge Day 27 Boxplot of Ramen Ratings by Country 🍜 Data Source: kaggle.com/datasets/resid… Github Repo: github.com/scullen99/30Da…
account_circle
Cullen(@s_cullen99) 's Twitter Profile Photo


Day 28

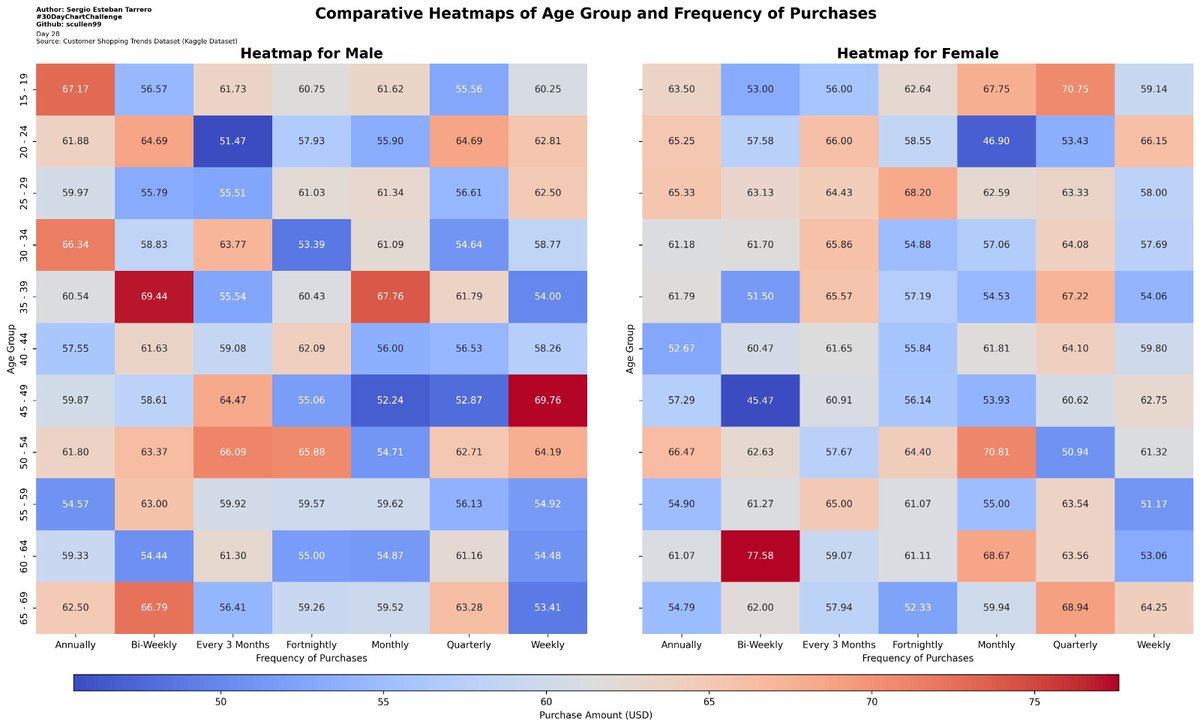
Comparative Heatmaps of Age Group and Frequency of Purchases 👕👖👢

Data Source: kaggle.com/datasets/iamso…
Github Repo: github.com/scullen99/30Da…

#30DayChartChallenge Day 28 Comparative Heatmaps of Age Group and Frequency of Purchases 👕👖👢 Data Source: kaggle.com/datasets/iamso… Github Repo: github.com/scullen99/30Da…
account_circle
Cullen(@s_cullen99) 's Twitter Profile Photo


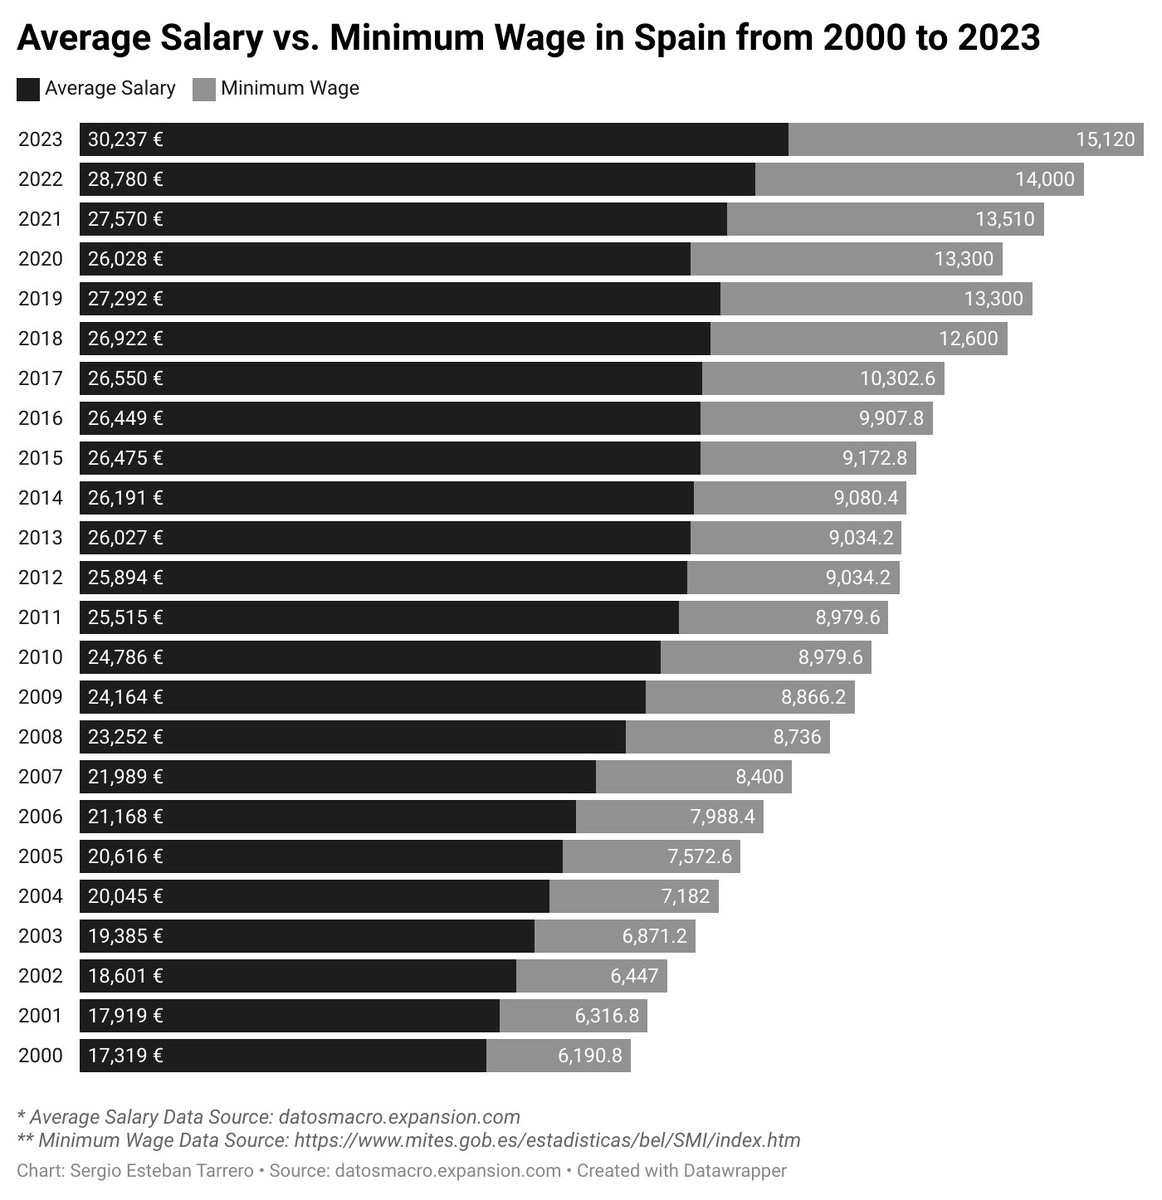
Day 29

Average Salary vs. Minimum Wage in Spain from 2000 to 2023 🇪🇦

Data Sources:
-datosmacro.expansion.com/mercado-labora…
-mites.gob.es/estadisticas/b…
Datawrapper Link: datawrapper.de/_/wGF7Q/?v=2
Github Repo: github.com/scullen99/30Da…

#30DayChartChallenge Day 29 Average Salary vs. Minimum Wage in Spain from 2000 to 2023 🇪🇦 Data Sources: -datosmacro.expansion.com/mercado-labora… -mites.gob.es/estadisticas/b… Datawrapper Link: datawrapper.de/_/wGF7Q/?v=2 Github Repo: github.com/scullen99/30Da…
account_circle
Cullen(@s_cullen99) 's Twitter Profile Photo


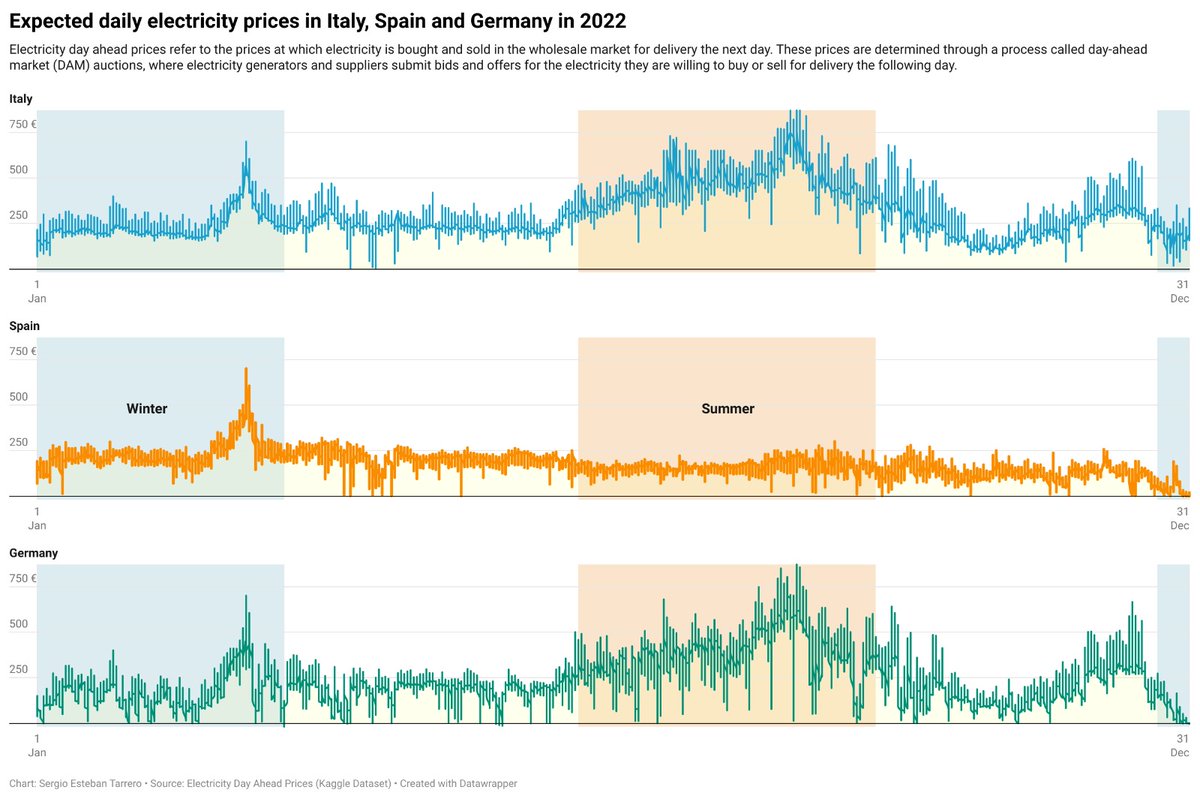
Day 30

Expected daily electricity prices in Italy, Spain and Germany in 2022 💡

Data Source: kaggle.com/datasets/henri…
Datawrapper Link: datawrapper.de/_/1wl1i/
Github Repo: github.com/scullen99/30Da…

#30DayChartChallenge Day 30 Expected daily electricity prices in Italy, Spain and Germany in 2022 💡 Data Source: kaggle.com/datasets/henri… Datawrapper Link: datawrapper.de/_/1wl1i/ Github Repo: github.com/scullen99/30Da…
account_circle