Global Markets Investor(@GlobalMktObserv) 's Twitter Profileg
Global Markets Investor

@GlobalMktObserv

Investment, Equity (for Wall Street), Macro Research background. ~10 years experience in markets, supporting investors in succeeding. Join 600+ FREE subscribers

ID:1679591758332657665

linkhttps://globalmarketsinvestor.substack.com calendar_today13-07-2023 20:41:03

8,0K Tweets

6,0K Followers

70 Following

Global Markets Investor(@GlobalMktObserv) 's Twitter Profile Photo

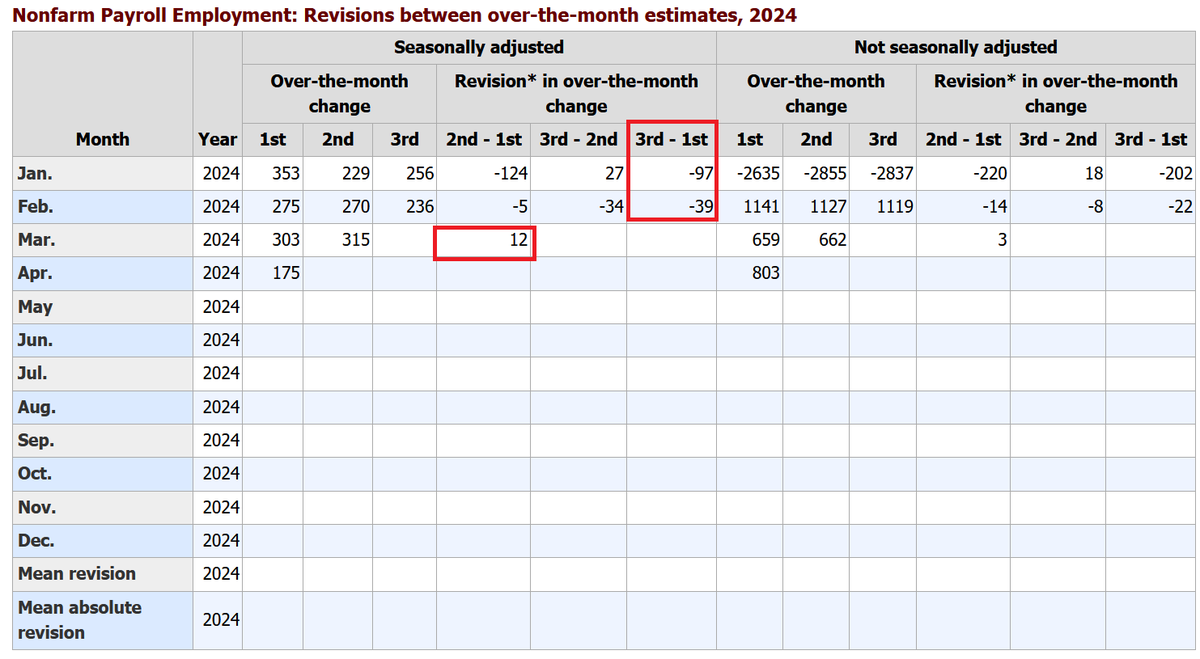
Total US non-farm payrolls (jobs data) revisions for Q1 so far:

January: -97,000
February: -39,000
March: +12,000 (need to wait a month for final revision)

TOTAL Q1 REVISIONS: -124,000

In other words, the data initially showed 124,00 more jobs created than the BLS shows now.

Total US non-farm payrolls (jobs data) revisions for Q1 so far: January: -97,000 February: -39,000 March: +12,000 (need to wait a month for final revision) TOTAL Q1 REVISIONS: -124,000 In other words, the data initially showed 124,00 more jobs created than the BLS shows now.
account_circle
Global Markets Investor(@GlobalMktObserv) 's Twitter Profile Photo

The US labor market is only strong in the headlines.

In April, US full-time jobs DECLINED by 0.6 million while part-time jobs ROSE by 1.1M.

In the past, such a divergence has only happened during recessions.

Read more about March and February below👇
open.techwriters.info/globalmarketsi…

account_circle
Global Markets Investor(@GlobalMktObserv) 's Twitter Profile Photo

Wall Street is celebrating weaker-than-expected jobs numbers in the non-farm payrolls data this morning.

This report allegedly pushes cut to earlier date.

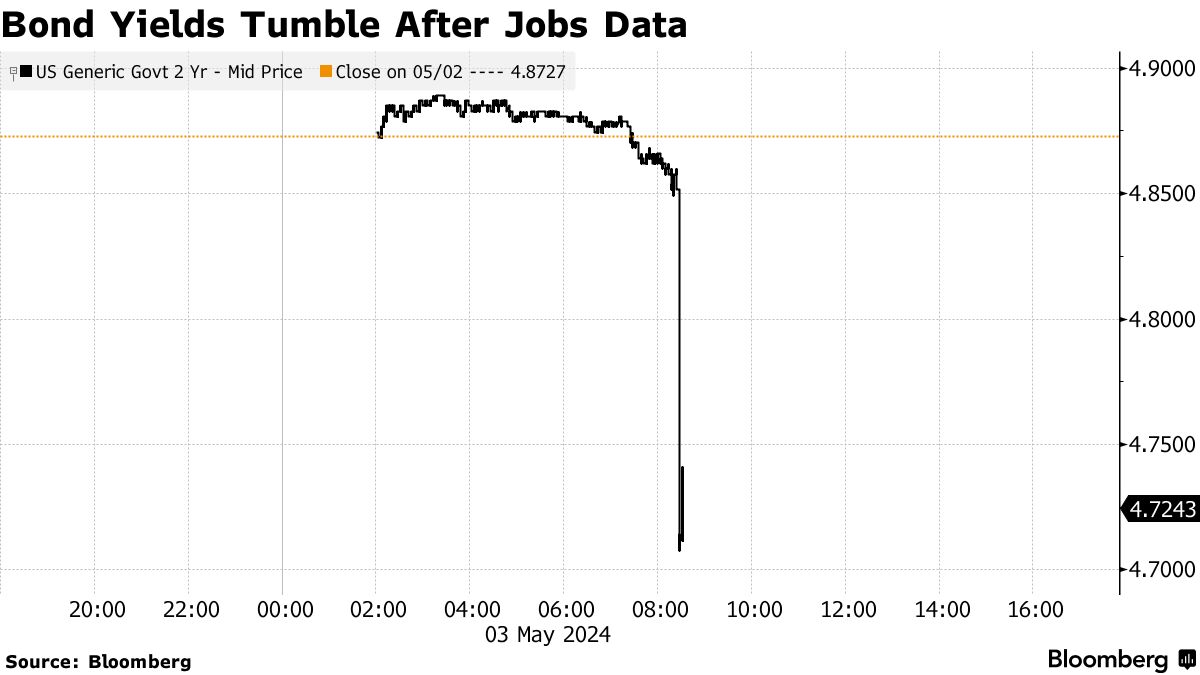
2-year Treasury yields are down whooping 15 basis points.

Bonds, stocks, gold, and crypto all are rallying. VIX tumbling.

Wall Street is celebrating weaker-than-expected jobs numbers in the non-farm payrolls data this morning. This report allegedly pushes cut to earlier date. 2-year Treasury yields are down whooping 15 basis points. Bonds, stocks, gold, and crypto all are rallying. VIX tumbling.
account_circle
Global Markets Investor(@GlobalMktObserv) 's Twitter Profile Photo

The Kobeissi Letter Since February 2019, the US national debt has increased by $12.5 trillion and the US GDP by $7.2 trillion.

Therefore, in the last 5 years for 1 unit of GDP, the US government has created 1.7 units of debt.

The US economy is becoming less productive every year.
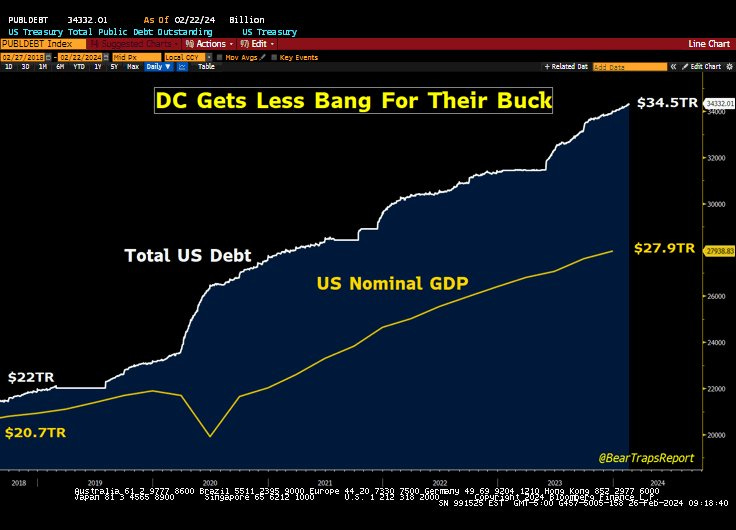
@KobeissiLetter Since February 2019, the US national debt has increased by $12.5 trillion and the US GDP by $7.2 trillion. Therefore, in the last 5 years for 1 unit of GDP, the US government has created 1.7 units of debt. The US economy is becoming less productive every year.
account_circle
The Kobeissi Letter(@KobeissiLetter) 's Twitter Profile Photo

JUST IN: US Consumer Confidence has dropped to its lowest level in 2 years in April 2024.

The Consumer Confidence Index fell to 97 points in April, declining for the 3rd straight month.

Meanwhile, US consumer expectations dropped below 80 points for the first time since July…

JUST IN: US Consumer Confidence has dropped to its lowest level in 2 years in April 2024. The Consumer Confidence Index fell to 97 points in April, declining for the 3rd straight month. Meanwhile, US consumer expectations dropped below 80 points for the first time since July…
account_circle
Global Markets Investor(@GlobalMktObserv) 's Twitter Profile Photo

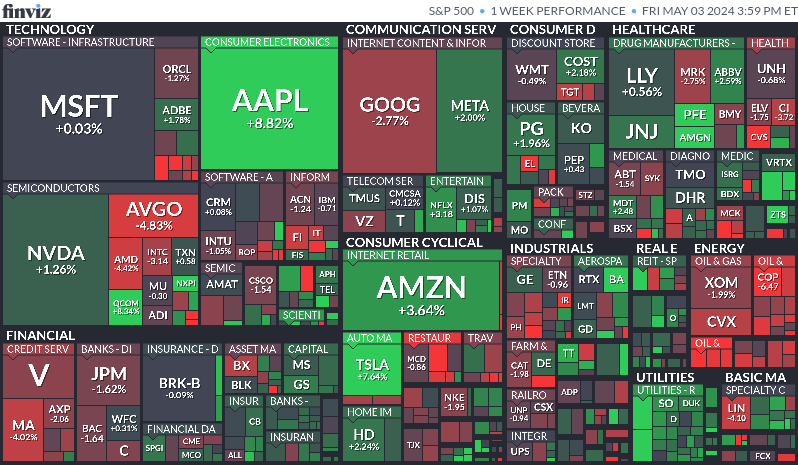
Following weaker on the headline jobs market data, stocks ended the week higher on earlier rate cut hopes in 2024. Performance This week:

S&P 500 +0.5%
Nasdaq +1.5%
Russell 2000 +1.6%
    📷+4.6%
Bank Index +0.5%
VIX -9.6%, front mth futures VIX -5.3%
Gold -1.1%

Following weaker on the headline jobs market data, stocks ended the week higher on earlier rate cut hopes in 2024. Performance This week: S&P 500 +0.5% Nasdaq +1.5% Russell 2000 +1.6% #Bitcoin    📷+4.6% Bank Index +0.5% VIX -9.6%, front mth futures VIX -5.3% Gold -1.1%
account_circle
Global Markets Investor(@GlobalMktObserv) 's Twitter Profile Photo

In the United States
'The bottom 50% account for 3% and their average annual healthcare costs are $385.

People with health spending in the top 1% have annual average costs of $166,980.'

Source: Apollo
apolloacademy.com/distribution-o…

account_circle
Global Markets Investor(@GlobalMktObserv) 's Twitter Profile Photo

Total US non-farm payrolls (jobs data) revisions for Q1 so far:

January: -97,000
February: -39,000
March: +12,000 (need to wait a month for final revision)

TOTAL Q1 REVISIONS: -124,000

Total US non-farm payrolls (jobs data) revisions for Q1 so far: January: -97,000 February: -39,000 March: +12,000 (need to wait a month for final revision) TOTAL Q1 REVISIONS: -124,000
account_circle
Global Markets Investor(@GlobalMktObserv) 's Twitter Profile Photo

The US economy now has:

1) Plummeting consumer confidence
2) 4 mths of hot inflation

3) $2 trillion annual deficits
4) ~$34.5T in debt

5) ~0.6 million full-time jobs decline with 1.1M part-time jobs created over a year

What could possibly go wrong?👇
open.techwriters.info/globalmarketsi…

account_circle
Global Markets Investor(@GlobalMktObserv) 's Twitter Profile Photo

The US labor market is only strong in the headlines.

In April, US full-time jobs DECLINED by 0.6 million Y/Y while part-time jobs ROSE by 1.1M

In the past, such a divergence has only happened during recessions.

Read more about March and February below👇
open.techwriters.info/globalmarketsi…

account_circle
Global Markets Investor(@GlobalMktObserv) 's Twitter Profile Photo

Remember that there is one US jobs report before the next Federal Reserve meeting,

The Fed is also focusing more on inflation data unless the labor market deteriorates materially which has not happened yet in April.

Not a big deal for the potential rate cuts yet.

Remember that there is one US jobs report before the next Federal Reserve meeting, The Fed is also focusing more on inflation data unless the labor market deteriorates materially which has not happened yet in April. Not a big deal for the potential rate cuts yet.
account_circle
Global Markets Investor(@GlobalMktObserv) 's Twitter Profile Photo

Is the Fed heading towards another monetary policy mistake?

'For someone who is following closely all these developments, there must be an impression that the Fed is strongly leaning towards rate cuts but the recent data did not let that happen.'
open.techwriters.info/globalmarketsi…

account_circle
Global Markets Investor(@GlobalMktObserv) 's Twitter Profile Photo

Wall Street is celebrating weaker-than-expected jobs numbers in the non-farm payrolls data this morning.

This report allegedly pushes cut to earlier date.

2-year Treasury yields are down whooping 15 basis points.

Bonds, stocks, gold, and crypto all are rallying. VIX tumbling.

Wall Street is celebrating weaker-than-expected jobs numbers in the non-farm payrolls data this morning. This report allegedly pushes cut to earlier date. 2-year Treasury yields are down whooping 15 basis points. Bonds, stocks, gold, and crypto all are rallying. VIX tumbling.
account_circle
Global Markets Investor(@GlobalMktObserv) 's Twitter Profile Photo

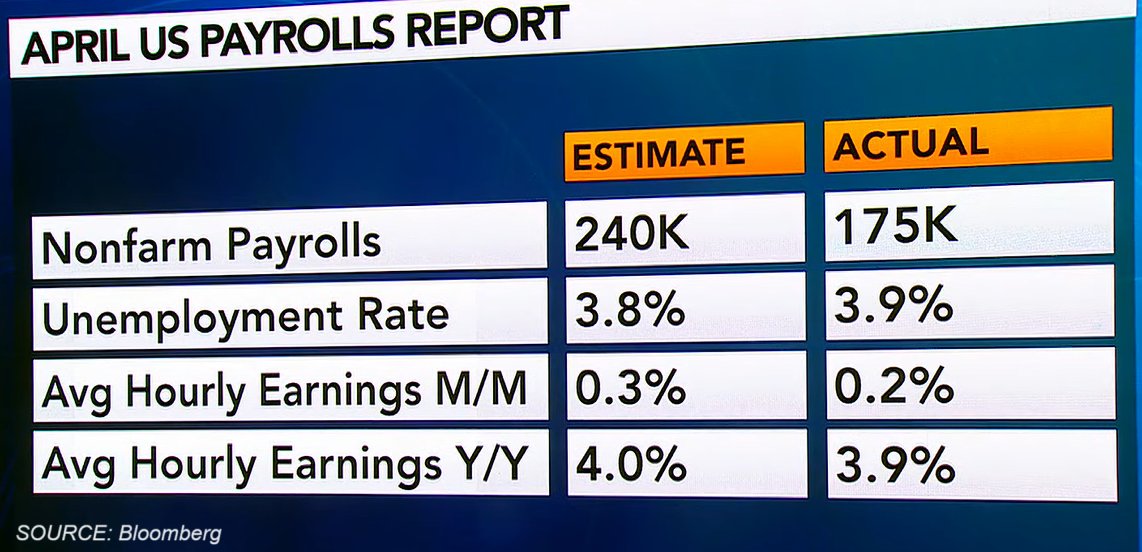
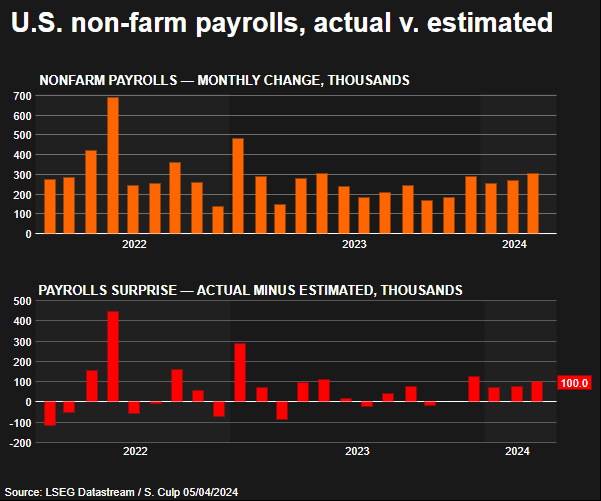
April US non-farm payrolls: +175k vs +240k estimated.

February revised down and March revised up but overall revisions for the prior two months totaled -22k.

Jobless rate rose to 3.9%.

The first-rate cut is seen now in September.

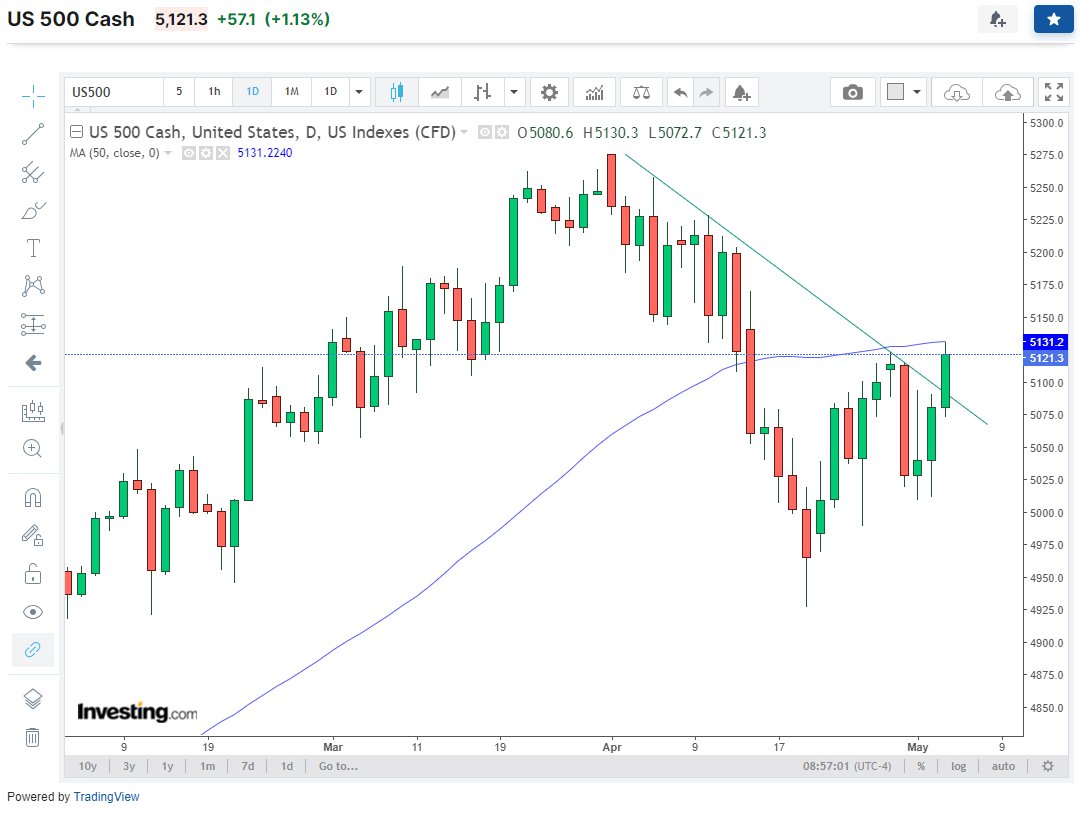
S&P 500 +1.1%, testing 50-day moving average.

April US non-farm payrolls: +175k vs +240k estimated. February revised down and March revised up but overall revisions for the prior two months totaled -22k. Jobless rate rose to 3.9%. The first-rate cut is seen now in September. S&P 500 +1.1%, testing 50-day moving average.
account_circle
Global Markets Investor(@GlobalMktObserv) 's Twitter Profile Photo

Total US non-farm payrolls (jobs data) revisions for Q1 so far:

January: -97,000
February: -39,000
March: +12,000 (need to wait a month for final revision)

TOTAL Q1 REVISIONS: -124,000

In other words, the data initially showed 124,00 more jobs created than the BLS shows now.

Total US non-farm payrolls (jobs data) revisions for Q1 so far: January: -97,000 February: -39,000 March: +12,000 (need to wait a month for final revision) TOTAL Q1 REVISIONS: -124,000 In other words, the data initially showed 124,00 more jobs created than the BLS shows now.
account_circle
Global Markets Investor(@GlobalMktObserv) 's Twitter Profile Photo

The US labor market is only strong in the headlines.

In April, US full-time jobs DECLINED by 0.6 million while part-time jobs ROSE by 1.1M.

In the past, such a divergence has only happened during recessions.

Read more about March and February below👇
open.techwriters.info/globalmarketsi…

account_circle
Global Markets Investor(@GlobalMktObserv) 's Twitter Profile Photo

US stocks are on a positive footing this morning. Though still below the key descending trendline and 50-day moving averages.

Dow Jones Industrial Average futures are up 0.8% driven by strong Apple earnings (incl. buybacks announcement).

S&P 500 up 0.4%
Nasdaq 100 +0.6%

US stocks are on a positive footing this morning. Though still below the key descending trendline and 50-day moving averages. Dow Jones Industrial Average futures are up 0.8% driven by strong Apple earnings (incl. buybacks announcement). S&P 500 up 0.4% Nasdaq 100 +0.6%
account_circle
Global Markets Investor(@GlobalMktObserv) 's Twitter Profile Photo

US LABOR MARKET IS ONLY STRONG IN MEDIA HEADLINES

Tomorrow, the BLS releases April non-farm payrolls.

The US has been 'adding' more than 250,000 jobs each month in Q1, beating expectations for 4 straight months.

At first glance it looks great but what's the reality?

🧵1/8👇

US LABOR MARKET IS ONLY STRONG IN MEDIA HEADLINES Tomorrow, the BLS releases April non-farm payrolls. The US has been 'adding' more than 250,000 jobs each month in Q1, beating expectations for 4 straight months. At first glance it looks great but what's the reality? 🧵1/8👇
account_circle
Global Markets Investor(@GlobalMktObserv) 's Twitter Profile Photo

Gold was up by nearly 1% after the Fed announcement and Powell's conference.

It is up by more than 12% year to date while the S&P 500 rose by 6%.

Over the last 5 years, it has returned ~84% versus the S&P 500 gain of 71%

What's next for gold?👇
open.techwriters.info/globalmarketsi…

account_circle