
Kevin Gordon
@KevRGordon
Director, Senior Investment Strategist, Charles Schwab & Co., Inc.
Disclosures: https://t.co/5libsyZoqZ
ID:1750557036062920704
25-01-2024 16:31:56
628 Tweets
1,5K Followers
167 Following
Follow People

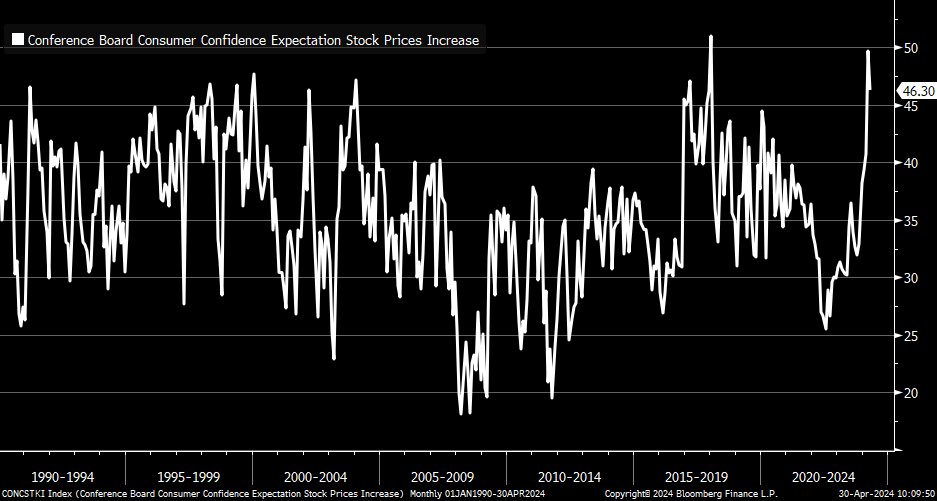
Looks like the pullback in April made consumers a bit less confident about rising stock prices per the The Conference Board Consumer Confidence Index ... still a bullish crowd, however


.Liz Ann Sonders and I look at this table every morning and it fascinates me ... there are currently more than 400 members in the S&P 500 outperforming $AAPL YTD
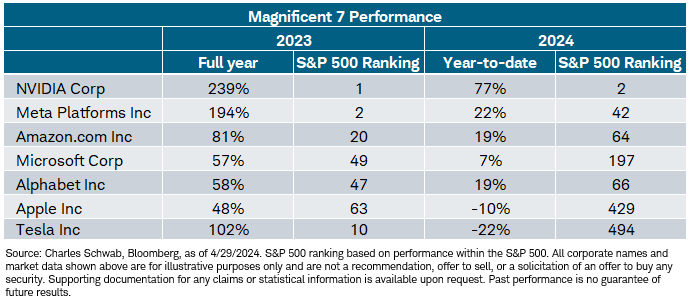


Latest from Liz Ann Sonders and me on earnings season and large-cap dominance schwab.com/learn/story/li…


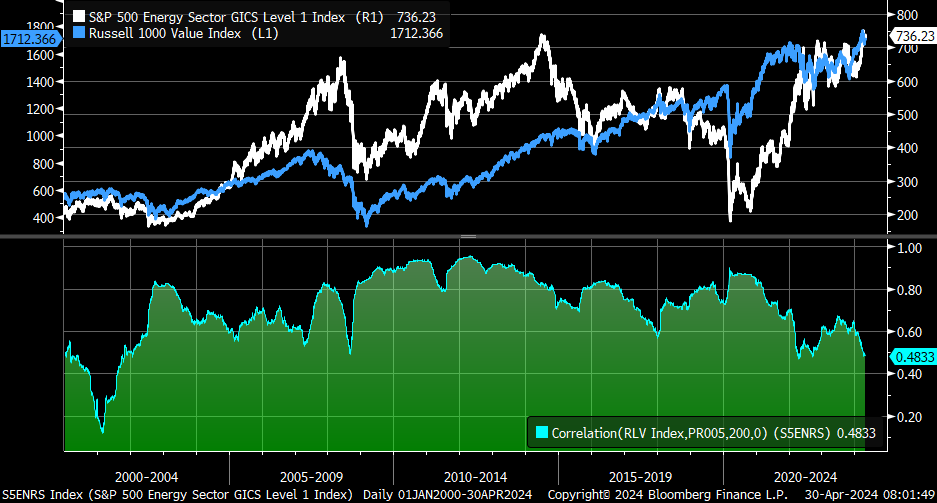
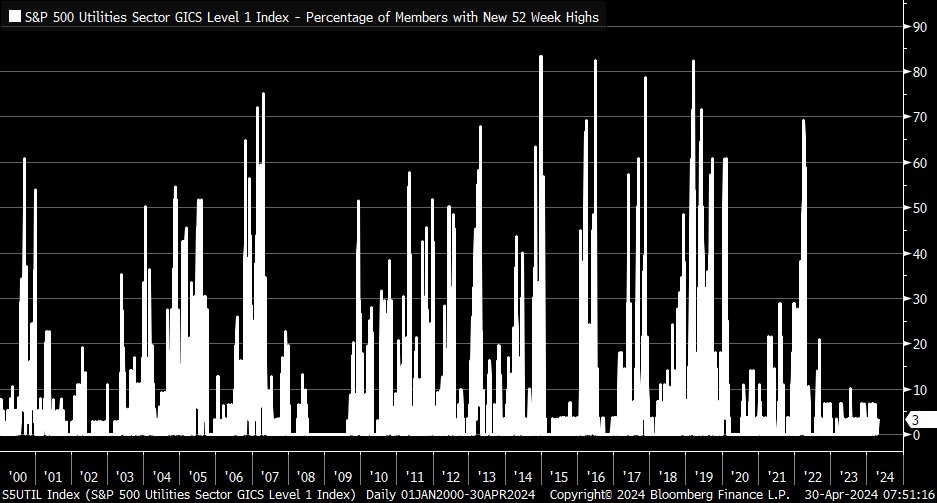
![Kevin Gordon (@KevRGordon) on Twitter photo 2024-04-30 12:00:19 As Tech sector has eased a bit relative to the broader market (white), % of members making a new 52-week high (blue) has also cooled off [Past performance is no guarantee of future results] As Tech sector has eased a bit relative to the broader market (white), % of members making a new 52-week high (blue) has also cooled off [Past performance is no guarantee of future results]](https://pbs.twimg.com/media/GMaUz67XgAAoGOc.png)
![Kevin Gordon (@KevRGordon) on Twitter photo 2024-04-29 15:48:19 So far, today is the best day for the S&P 500 Auto Industry since March 2021 (note that there are only 3 members in the group) [Past performance is no guarantee of future results] So far, today is the best day for the S&P 500 Auto Industry since March 2021 (note that there are only 3 members in the group) [Past performance is no guarantee of future results]](https://pbs.twimg.com/media/GMV_c2LXsAAmrCB.png)
![Kevin Gordon (@KevRGordon) on Twitter photo 2024-04-29 14:50:57 Here are the 'fab four' that have market caps > $2 trillion $MSFT $AAPL $NVDA $GOOGL [Past performance is no guarantee of future results; individual stocks shown for illustration] Here are the 'fab four' that have market caps > $2 trillion $MSFT $AAPL $NVDA $GOOGL [Past performance is no guarantee of future results; individual stocks shown for illustration]](https://pbs.twimg.com/media/GMVyJCfWUAA8BbH.jpg)
![Kevin Gordon (@KevRGordon) on Twitter photo 2024-04-29 12:17:27 Here is sector performance since the S&P 500's recent peak at the end of March ... Energy, Comm Services, and Utilities lead while Real Estate is in last [Past performance is no guarantee of future results; data from @business] Here is sector performance since the S&P 500's recent peak at the end of March ... Energy, Comm Services, and Utilities lead while Real Estate is in last [Past performance is no guarantee of future results; data from @business]](https://pbs.twimg.com/media/GMVPMoFXYAAG8VX.png)
![Kevin Gordon (@KevRGordon) on Twitter photo 2024-04-29 12:12:56 Mag7 (orange) down by nearly 1% this month, which is much better than cap-weighted (white) and equal-weighted (blue) S&P 500 ... worth noting that latter two indexes outperformed Mag7 in March, though [Past performance is no guarantee of future results] Mag7 (orange) down by nearly 1% this month, which is much better than cap-weighted (white) and equal-weighted (blue) S&P 500 ... worth noting that latter two indexes outperformed Mag7 in March, though [Past performance is no guarantee of future results]](https://pbs.twimg.com/media/GMVOBgmX0AExHKF.png)
![Kevin Gordon (@KevRGordon) on Twitter photo 2024-04-29 11:28:01 Cap-weighted Communication Services sector continues to dominate relative to equal-weighted version [Past performance is no guarantee of future results] Cap-weighted Communication Services sector continues to dominate relative to equal-weighted version [Past performance is no guarantee of future results]](https://pbs.twimg.com/media/GMVD4q7WAAACvDE.png)