Economic Research Service(@USDA_ERS) 's Twitter Profileg
Economic Research Service

@USDA_ERS

The economics of food, farming, natural resources, & rural America -- from USDA's Economic Research Service (ERS)

ID:60654735

linkhttp://www.ers.usda.gov calendar_today27-07-2009 17:25:59

10,1K Tweets

70,2K Followers

59 Following

Economic Research Service(@USDA_ERS) 's Twitter Profile Photo

Livestock and Meat Domestic Data — current and historical data on pork, beef, veal, and poultry, including production, supply, utilization, and farm prices.

Learn more: ers.usda.gov/data-products/….

account_circle
Economic Research Service(@USDA_ERS) 's Twitter Profile Photo

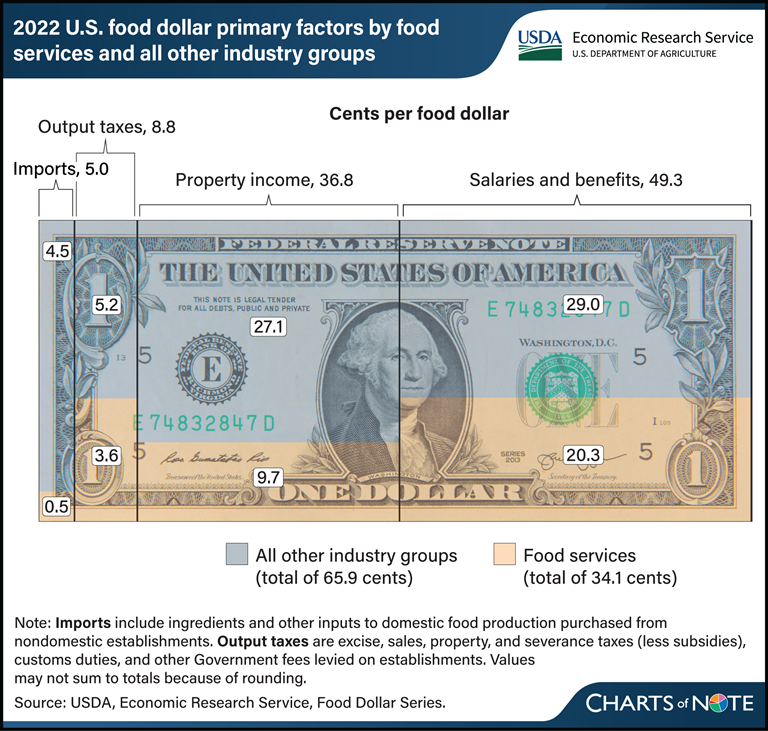
About 20 cents of each dollar spent on food in 2022 went to foodservice labor costs. Learn more in today's Chart of Note: ers.usda.gov/data-products/….

About 20 cents of each dollar spent on food in 2022 went to foodservice labor costs. Learn more in today's Chart of Note: ers.usda.gov/data-products/….
account_circle
Economic Research Service(@USDA_ERS) 's Twitter Profile Photo

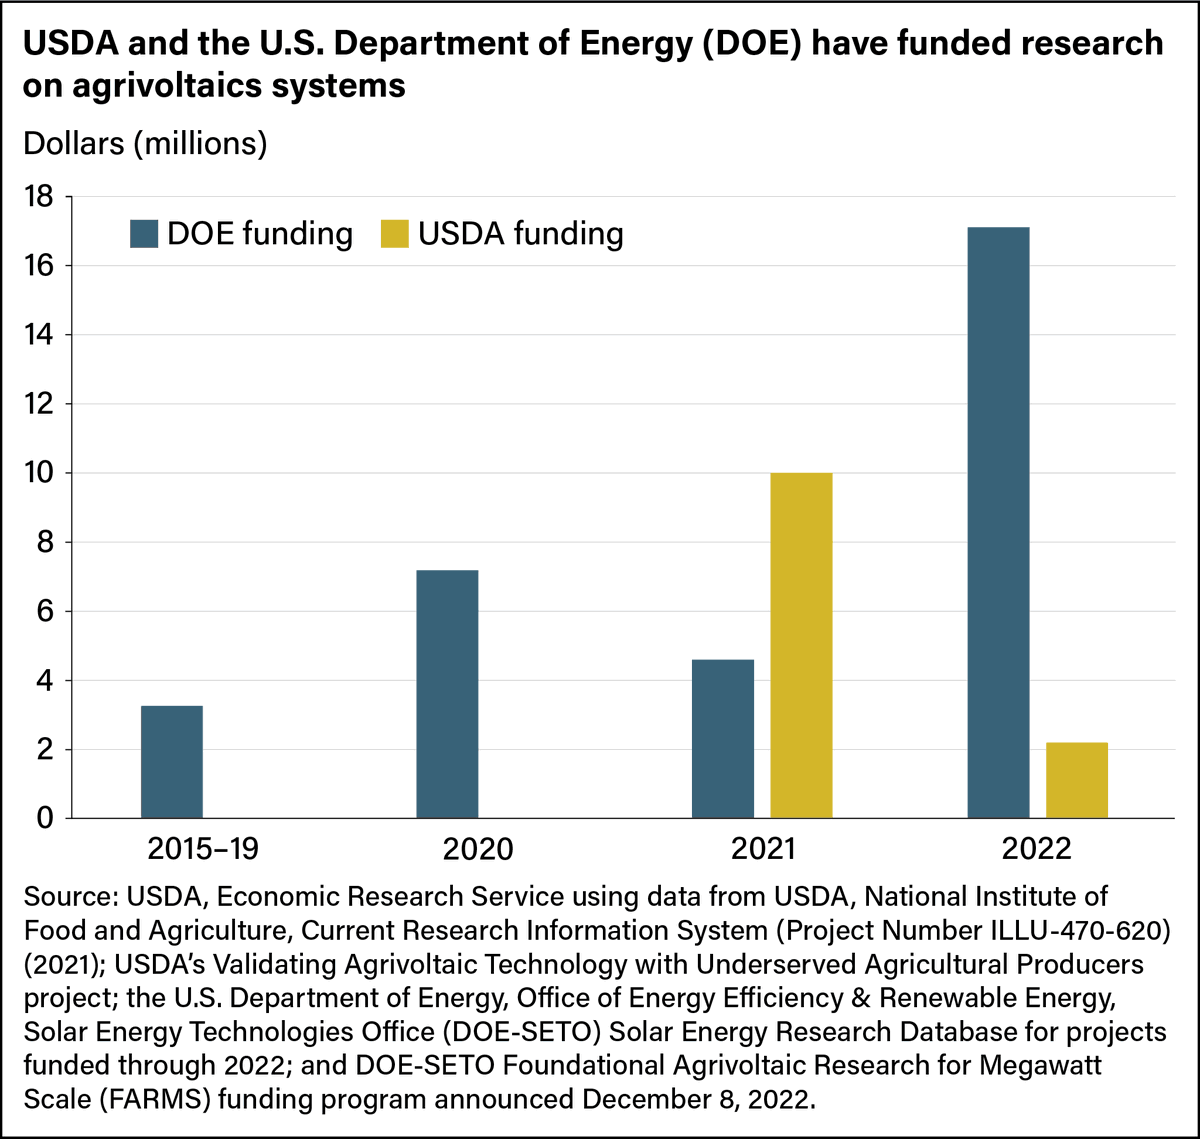
Common Ground for Agriculture and Solar Energy: Federal Funding Supports Research and Development in Agrivoltaics

Learn more in this month's Amber Wave: ers.usda.gov/amber-waves/20…

Common Ground for Agriculture and Solar Energy: Federal Funding Supports Research and Development in Agrivoltaics Learn more in this month's Amber Wave: ers.usda.gov/amber-waves/20…
account_circle
Economic Research Service(@USDA_ERS) 's Twitter Profile Photo

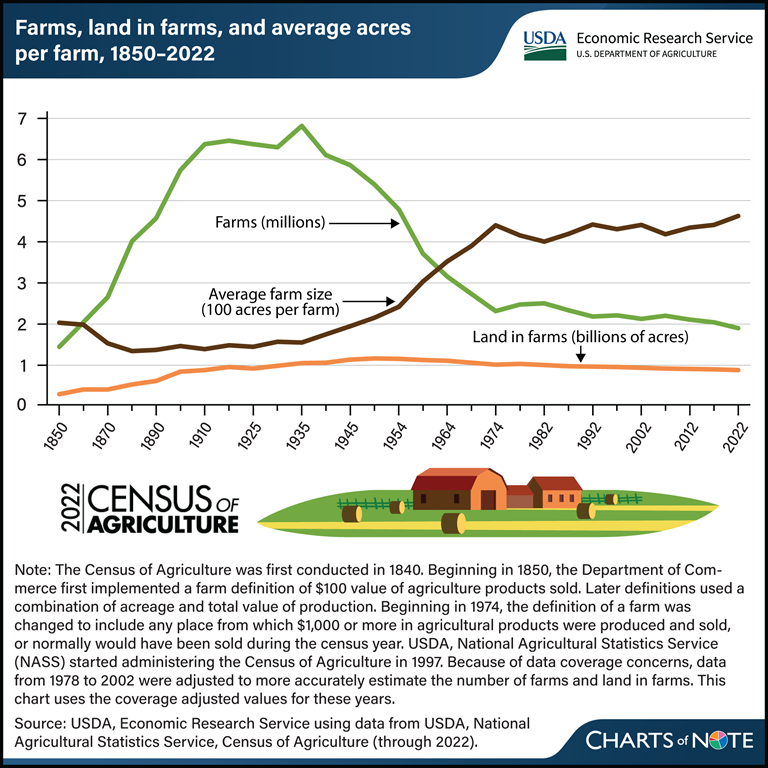
2022 Census of Agriculture: Number of U.S. farms falls below 2 million. Learn more: ers.usda.gov/data-products/….

2022 Census of Agriculture: Number of U.S. farms falls below 2 million. Learn more: ers.usda.gov/data-products/….
account_circle
Economic Research Service(@USDA_ERS) 's Twitter Profile Photo

Natural disasters, disease cut Florida orange production an estimated 92 percent since 2003/04.

Learn more in today's Chart of Note: ers.usda.gov/data-products/….

Natural disasters, disease cut Florida orange production an estimated 92 percent since 2003/04. Learn more in today's Chart of Note: ers.usda.gov/data-products/….
account_circle
Economic Research Service(@USDA_ERS) 's Twitter Profile Photo

April Food Price Outlook – In 2024, food-at-home prices are predicted to increase 1.2 percent, and food-away-from-home prices are predicted to increase 4.2 percent. 

Learn more: ers.usda.gov/data-products/…

account_circle
National Agricultural Statistics Service(@usda_nass) 's Twitter Profile Photo

Updated files for Crop Sequence Boundaries that offer visual crop rotation data are now available. Developed with Economic Research Service, CSB is a map of ag fields that provides crop acreage estimates & historical planting decisions across the U.S. Discover more ➡️ nass.usda.gov/Research_and_S…
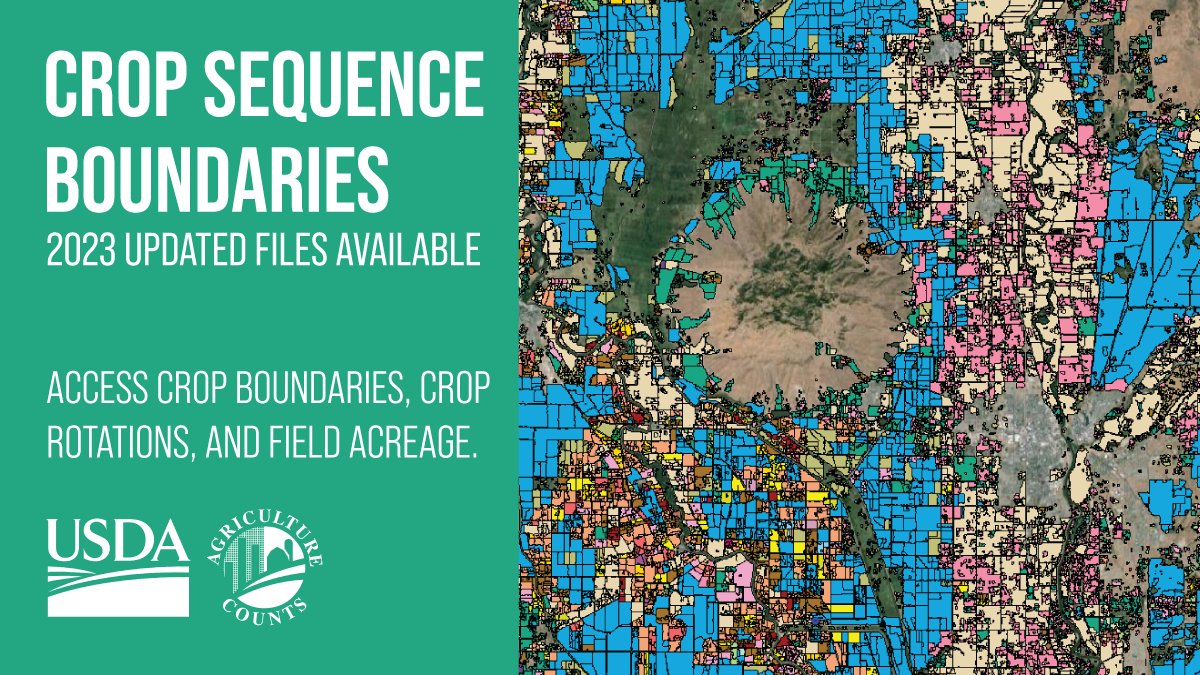
Updated files for Crop Sequence Boundaries that offer visual crop rotation data are now available. Developed with @USDA_ERS, CSB is a map of ag fields that provides crop acreage estimates & historical planting decisions across the U.S. Discover more ➡️ nass.usda.gov/Research_and_S…
account_circle
Economic Research Service(@USDA_ERS) 's Twitter Profile Photo

We couldn't do it without you! Thank you to the fantastic Administrative Professionals at ERS for playing a critical role in ensuring we deliver timely research to the public.

We couldn't do it without you! Thank you to the fantastic Administrative Professionals at ERS for playing a critical role in ensuring we deliver timely research to the public.
account_circle
Economic Research Service(@USDA_ERS) 's Twitter Profile Photo

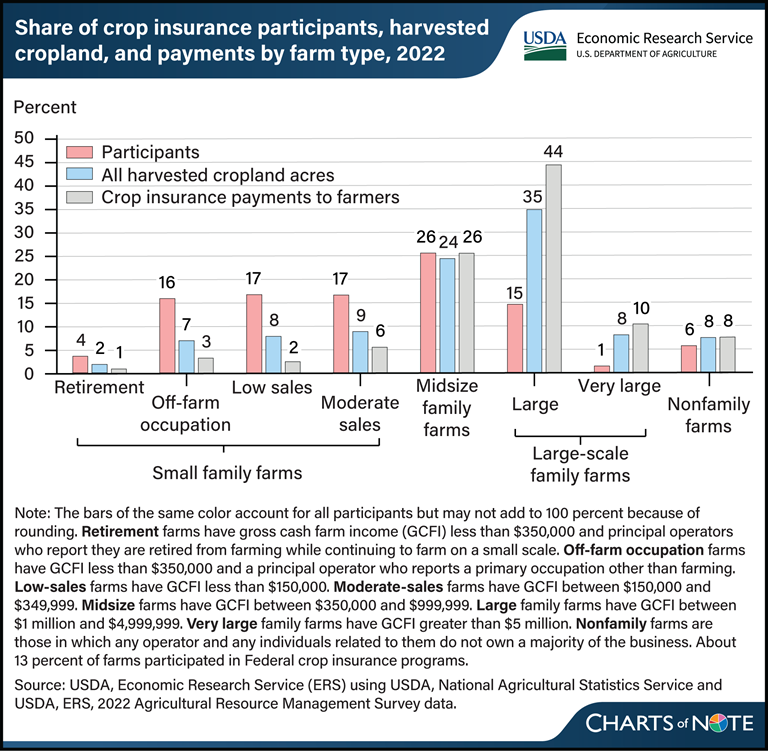
Crop insurance payments to farmers vary by farm type.

Learn more in today's Chart of Note: ers.usda.gov/data-products/…

Crop insurance payments to farmers vary by farm type. Learn more in today's Chart of Note: ers.usda.gov/data-products/…
account_circle
Economic Research Service(@USDA_ERS) 's Twitter Profile Photo

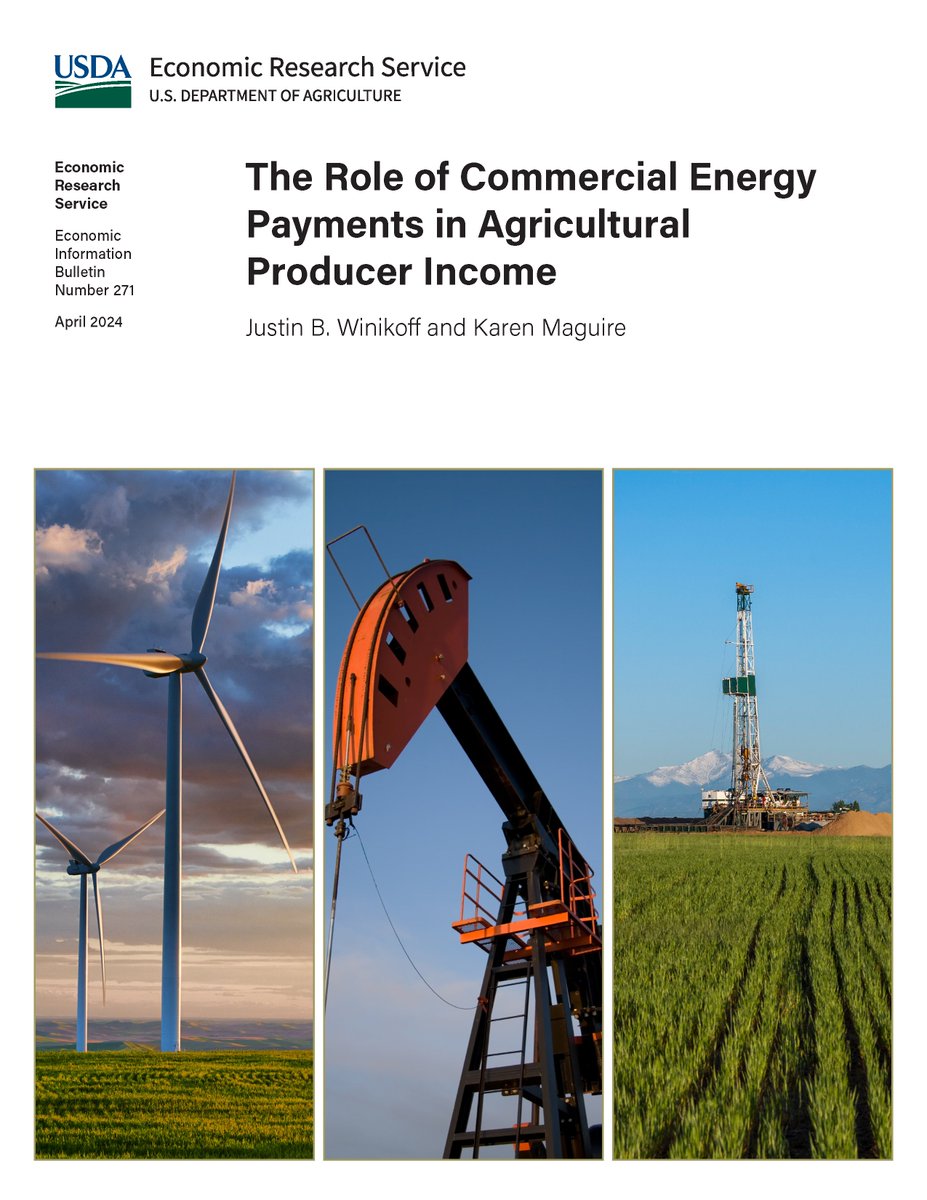
Approximately 3.5 percent of farm operators reported receiving payments for energy production on their operation between 2011 and 2020, with an average annual payment of $30,482 (in 2020 dollars).

Learn more: ers.usda.gov/publications/p….

Approximately 3.5 percent of farm operators reported receiving payments for energy production on their operation between 2011 and 2020, with an average annual payment of $30,482 (in 2020 dollars). Learn more: ers.usda.gov/publications/p….
account_circle
Economic Research Service(@USDA_ERS) 's Twitter Profile Photo

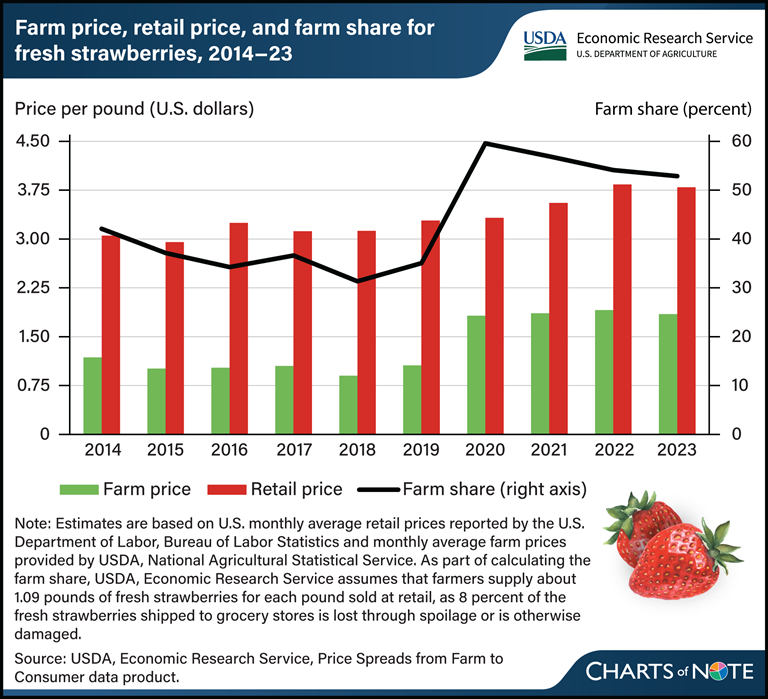
Farmers received about half of what consumers paid for fresh strawberries from 2020–23.

Learn more in today's Chart of Note: ers.usda.gov/data-products/….

Farmers received about half of what consumers paid for fresh strawberries from 2020–23. Learn more in today's Chart of Note: ers.usda.gov/data-products/….
account_circle
Economic Research Service(@USDA_ERS) 's Twitter Profile Photo

ERS' U.S. Bioenergy Statistics are a source of information on biofuels intended to present a picture of the renewable energy industry and its relationship to agriculture.

Learn more: ers.usda.gov/data-products/…

account_circle
Economic Research Service(@USDA_ERS) 's Twitter Profile Photo

Raw-Fiber Equivalents of U.S. Textile Trade Data — U.S. textile imports and exports by fiber and U.S. cotton textile trade by origin and destination.

Learn more: ers.usda.gov/data-products/….

account_circle