Corbin Moore(@corbinmoore1) 's Twitter Profileg
Corbin Moore

@corbinmoore1

HCESC Data Consultant, OCSS Past President, Data Nerd, Husband, Father, Grandpa

ID:747904974

calendar_today09-08-2012 20:43:06

2,0K Tweets

721 Followers

796 Following

Coach Minderman(@CoachMinderman) 's Twitter Profile Photo

Dr. Scott M. Petri EdSurge Peter Paccone Adam Moler Joe Schmidt Corbin Moore Thinking Nation AI-assisted grading done well opens up TONS of possibilities, can fundamentally alter how teacher approach instruction. “Done well” is the key here though, not “AI-assisted”

account_circle
MikeDardisWLWT(@MikeDardisWLWT) 's Twitter Profile Photo

Repost if you don’t mind. I’m closing in on 20,000 followers. Please follow if you haven’t already. Thank you in advance.

account_circle
The Cincy Hat by Ted Karras(@CincyHat) 's Twitter Profile Photo

We have a beautiful brand new red mid crown ballcap dropping tomorrow with our new Spring Training Series. One of my favorite hats we’ve ever made, my money is on this being our top seller of the season 🤤

We have a beautiful brand new red mid crown ballcap dropping tomorrow with our new Spring Training Series. One of my favorite hats we’ve ever made, my money is on this being our top seller of the season 🤤
account_circle
Laura Tilton 📚📊(@tiltondata) 's Twitter Profile Photo

Fun tip if you build a report that gets accessed via mobile phone. Users can “Add to Home Screen” on iPhone to add a shortcut. AND if you use an emoji as the first character in the report title, that emoji will appear as the shortcut’s icon. 👍🏼

account_circle
Ben Collins(@benlcollins) 's Twitter Profile Photo

If you want to improve your skills this year, I'd recommend learning to use pivot tables.

They're so powerful. With just a few clicks, you can summarize thousands of rows of data. 🤯

If you aren't familiar with them, get up to speed here: benlcollins.com/spreadsheets/p…

account_circle
Mehdi Oudjida(@wissi_analytics) 's Twitter Profile Photo

release - Dec 21, 2023

- New chart type: Connection map - Location data as sequences of connected points
- Display values of reference lines & reference bands
- Stepped lines for series, line & combo charts
- Update of Search Ads 360 connector
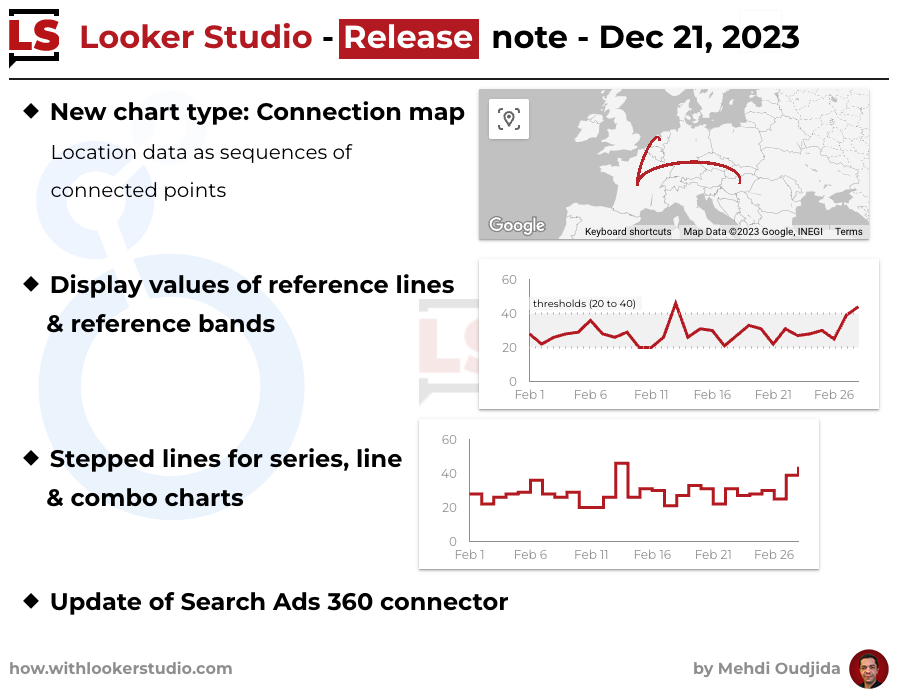
#LookerStudio release - Dec 21, 2023 - New chart type: Connection map - Location data as sequences of connected points - Display values of reference lines & reference bands - Stepped lines for series, line & combo charts - Update of Search Ads 360 connector
account_circle
Mehdi Oudjida(@wissi_analytics) 's Twitter Profile Photo

- New feature - Dec 14, 2023
New style options for table charts: Resizable height of rows and option for auto-height
(with an option to freeze all columns up to another)

#LookerStudio - New feature - Dec 14, 2023 New style options for table charts: Resizable height of rows and option for auto-height (with an option to freeze all columns up to another)
account_circle
Mehdi Oudjida(@wissi_analytics) 's Twitter Profile Photo

- New feature - Dec 14, 2023

Value grouping for dimension fields.
A way to create a classification of values for a specific dimension with cascading rules. A simple alternative of calculated fields with CASE statement.
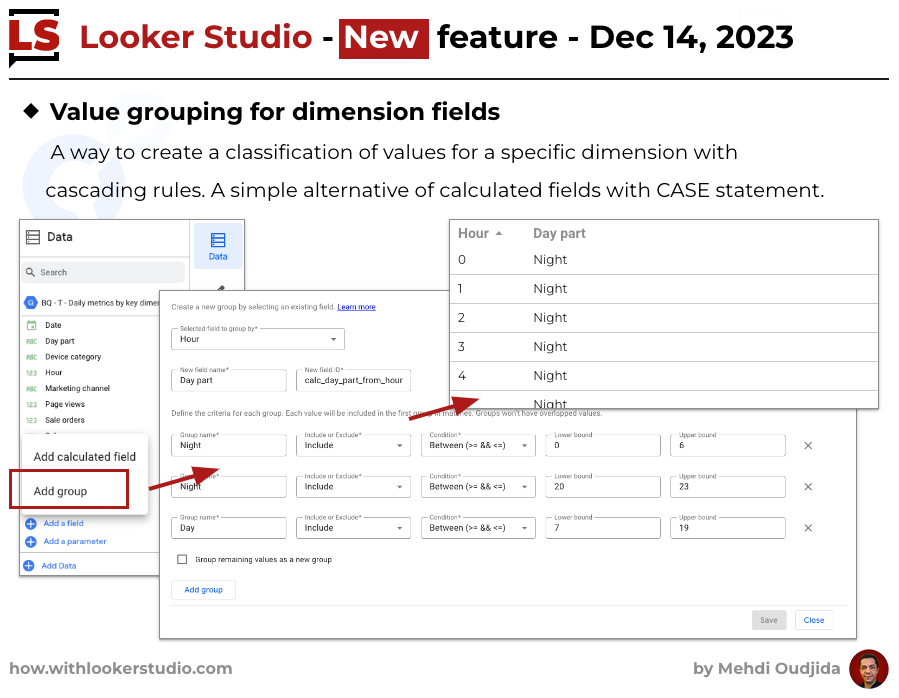
#LookerStudio - New feature - Dec 14, 2023 Value grouping for dimension fields. A way to create a classification of values for a specific dimension with cascading rules. A simple alternative of calculated fields with CASE statement.
account_circle
Ben Collins(@benlcollins) 's Twitter Profile Photo

Tried the Data Analysis custom GPT from OpenAI and it's eye-opening.

Drop in a CSV file and let it go to work.

It's getter easier to work with and gives better results.

Tried the Data Analysis custom GPT from @OpenAI and it's eye-opening. Drop in a CSV file and let it go to work. It's getter easier to work with and gives better results.
account_circle
Ben Collins(@benlcollins) 's Twitter Profile Photo

Quick tip to start the week:

When you hover over a cell with multiple hyperlinks, they show up sequentially in a box.

And if you right click on a cell with multiple hyperlinks, you can open them all at once. Handy!
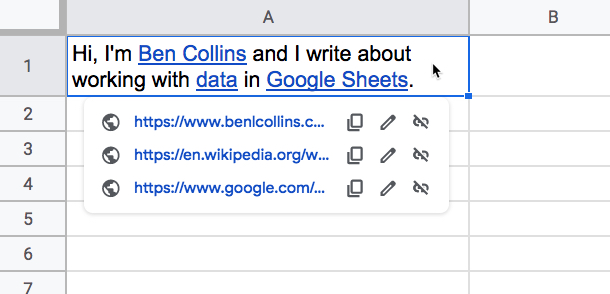
Quick #GoogleSheets tip to start the week: When you hover over a cell with multiple hyperlinks, they show up sequentially in a box. And if you right click on a cell with multiple hyperlinks, you can open them all at once. Handy!
account_circle
Corbin Moore(@corbinmoore1) 's Twitter Profile Photo

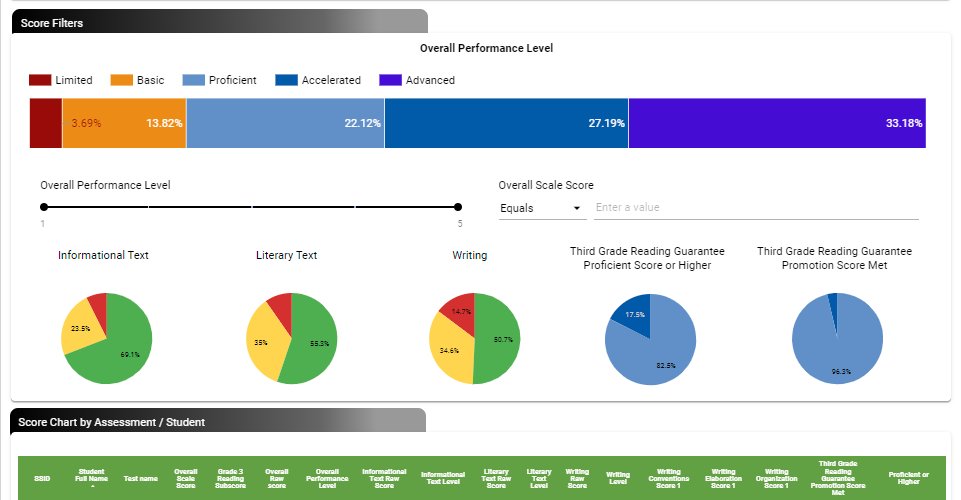
As promised here is a link to a new LS Dashboard to help you visualize your building/district's Fall 2023 Grade 3 OST Results on a new See More Data Site...
sites.google.com/view/seemoreda…

As promised here is a link to a new LS Dashboard to help you visualize your building/district's Fall 2023 Grade 3 OST Results on a new See More Data Site... sites.google.com/view/seemoreda… #SeeMoreData #ConstellationsDataProject
account_circle
Corbin Moore(@corbinmoore1) 's Twitter Profile Photo

We had to adjust the OST Results Template due to vendor changes to the CSV report. Look for a how-to video to connect your Grade 3 ELA OST Scores to the linked Looker Studio Template tomorrow morning. Power BI Template Coming Soon! HCESC lookerstudio.google.com/reporting/1bb7…

We had to adjust the OST Results Template due to vendor changes to the CSV report. Look for a how-to video to connect your Grade 3 ELA OST Scores to the linked Looker Studio Template tomorrow morning. Power BI Template Coming Soon! @HamiltonCoESC lookerstudio.google.com/reporting/1bb7…
account_circle
Ben Collins(@benlcollins) 's Twitter Profile Photo

I have a very useful tip for you today...

Let me show you how to quickly and easily remove duplicates from your data ranges.
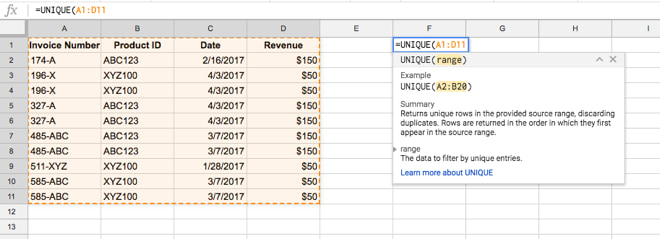
I have a very useful #GoogleSheets tip for you today... Let me show you how to quickly and easily remove duplicates from your data ranges.
account_circle
Mehdi Oudjida(@wissi_analytics) 's Twitter Profile Photo

- Super ⬛️BLACK FRIDAY OFFER
100% OFF! Woohoo!
By the way, it was already free...sorry.

A new version of my extension for LS is coming, with options to obfuscate text or/and numeric data displayed in your reports.
To be informed: bit.ly/3JTDbLe

account_circle
Microsoft Power BI(@MSPowerBI) 's Twitter Profile Photo

Activate your data's potential.

Transform your organization.

Announced at —Microsoft Fabric. Discover how to visualize data at the speed of thought.

account_circle