The {gt}/great_tables Packages(@gt_package) 's Twitter Profileg
The {gt}/great_tables Packages

@gt_package

Table generation packages for R and Python. Helping you make beautiful tables since 2018. Join our wonderful Discord at https://t.co/QImzxY4SM8

ID:1563014643450200066

linkhttps://gt.rstudio.com calendar_today26-08-2022 04:06:47

151 Tweets

2,8K Followers

2,6K Following

Andrew Weatherman(@andreweatherman) 's Twitter Profile Photo

I loved this visualization design when I saw it on my timeline a few days ago.

Knew that it was possible to recreate it using the The {gt}/great_tables Packages in R. Here's exactly how to do it (opted to bold the juror numbers). Got pretty close! 🖥️👇

gist.github.com/andreweatherma…

I loved this visualization design when I saw it on my timeline a few days ago. Knew that it was possible to recreate it using the @gt_package in R. Here's exactly how to do it (opted to bold the juror numbers). Got pretty close! 🖥️👇 gist.github.com/andreweatherma…
account_circle
Kari(@karbartolome) 's Twitter Profile Photo

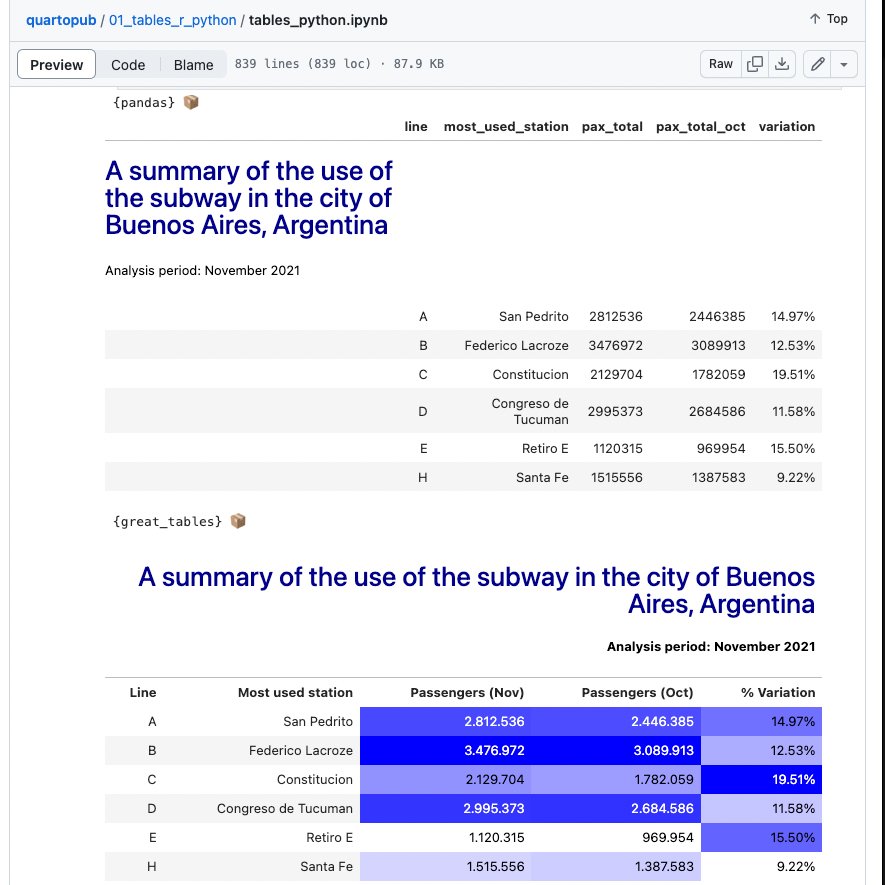
Soy fan de {pandas}📦.style pero por alguna razón se renderiza mal en Github. Estuve probando y {great_tables}📦 ({gt} de R en versión python) sí se renderiza bien:
github.com/karbartolome/q…

Soy fan de {pandas}📦.style pero por alguna razón se renderiza mal en Github. Estuve probando y {great_tables}📦 ({gt} de R en versión python) sí se renderiza bien: github.com/karbartolome/q…
account_circle
Emily Riederer(@EmilyRiederer) 's Twitter Profile Photo

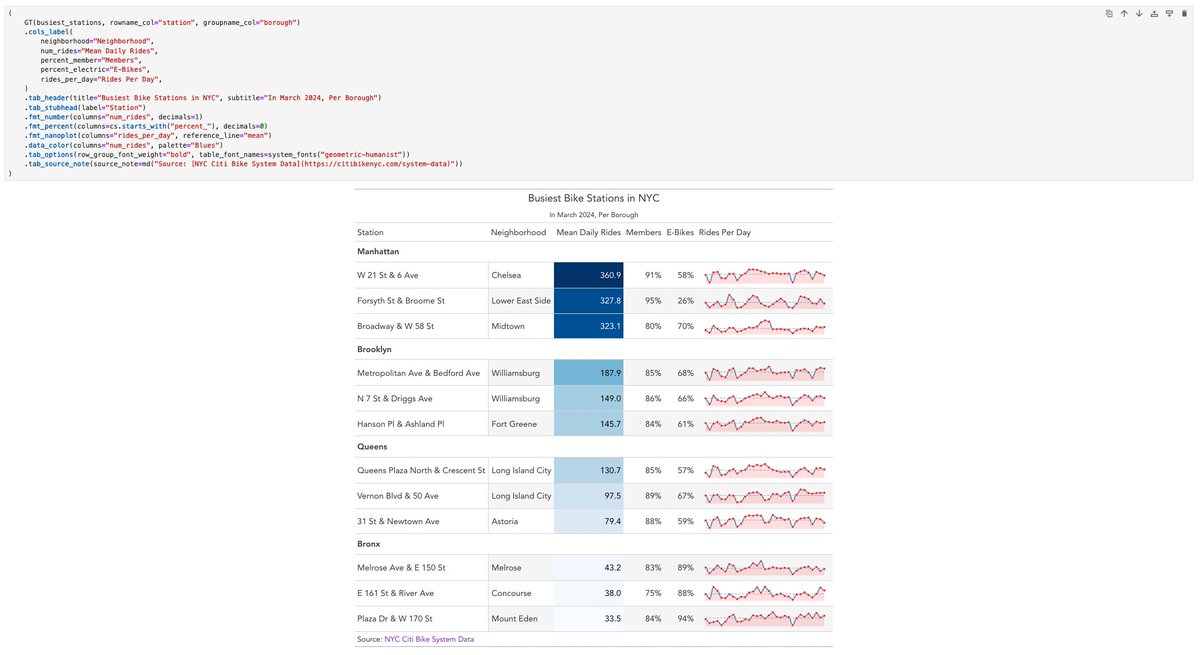
The python version of The {gt}/great_tables Packages just released nanoplots for tables! Loving the examples with polars data -- beautiful syntax and output

Check it out: posit-dev.github.io/great-tables/b…

The python version of @gt_package just released nanoplots for tables! Loving the examples with @DataPolars -- beautiful syntax and output Check it out: posit-dev.github.io/great-tables/b…
account_circle
Liam Brannigan(@braaannigan) 's Twitter Profile Photo

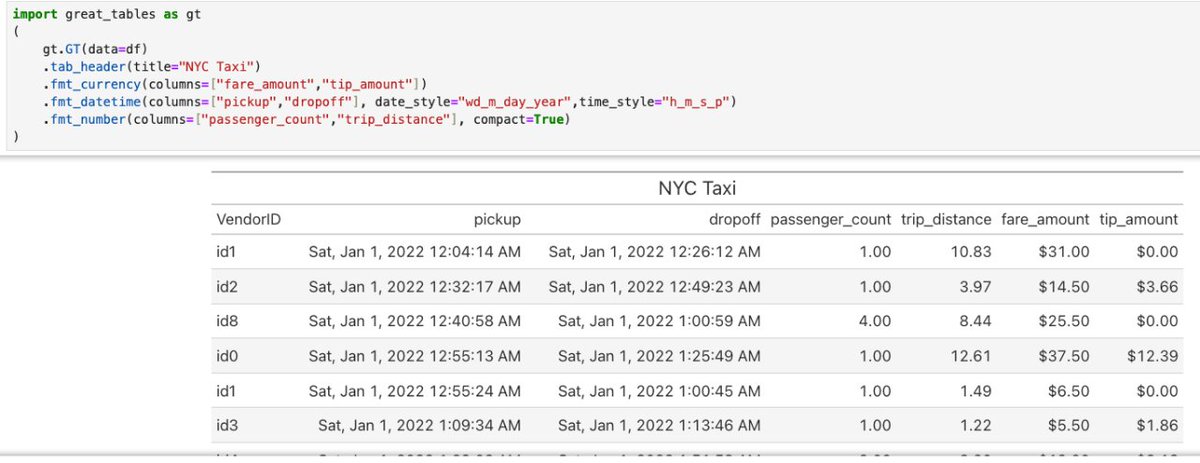
Want html formatting of a DataFrame? Check out the great-tables library. Here we get more insight on NYC taxi data by formatting the pickup so we can see what day and time of the week it was, while we can pick out the monetary columns with the $

API docs: pypi.org/project/great-…

Want html formatting of a DataFrame? Check out the great-tables library. Here we get more insight on NYC taxi data by formatting the pickup so we can see what day and time of the week it was, while we can pick out the monetary columns with the $ API docs: pypi.org/project/great-…
account_circle
Federico Alegría(@fdalegriag) 's Twitter Profile Photo

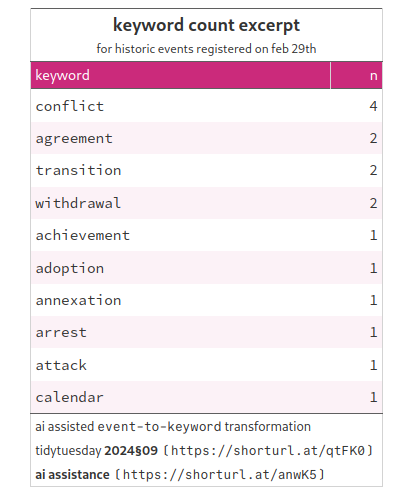
for 2024§09, i continued to dive in the The {gt}/great_tables Packages fantastic documentation. the result, a humble yet useful table for crunching events to single-word tokens via ai-assistance.
github.com/federicoalegri…

for #tidytuesday 2024§09, i continued to dive in the @gt_package fantastic documentation. the result, a humble yet useful table for crunching events to single-word tokens via ai-assistance. #rstats github.com/federicoalegri…
account_circle
The {gt}/great_tables Packages(@gt_package) 's Twitter Profile Photo

[RELEASE, BLOG POST]
Great Tables `v0.3.0` is now released! There's an intro blog post at:

posit-dev.github.io/great-tables/b…

Many new methods added, and `cols_width()`, `tab_options()`, and `fmt_image()` are the notable ones. Don't know GT? Check out the GH repo:

github.com/posit-dev/grea…

[RELEASE, BLOG POST] Great Tables `v0.3.0` is now released! There's an intro blog post at: posit-dev.github.io/great-tables/b… Many new methods added, and `cols_width()`, `tab_options()`, and `fmt_image()` are the notable ones. Don't know GT? Check out the GH repo: github.com/posit-dev/grea…
account_circle
iVo Villanueva(@elcheff) 's Twitter Profile Photo

Valoración de los jugadores de la esta semana en Europa antes de la J2️⃣1️⃣ con vistas al 💾
Datos: Proballers
Tenemos secuela Birgander con Todorovic?

Valoración de los jugadores de la #LigaEndesa esta semana en Europa antes de la J2️⃣1️⃣ con vistas al #SuperManagerACB 💾 Datos: @Proballers_FR Tenemos secuela Birgander con Todorovic?
account_circle
The {gt}/great_tables Packages(@gt_package) 's Twitter Profile Photo

[RELEASE, BLOG POST]
Great Tables `v0.2.0` is now released on PyPI! We wrote a blog post about it here:

posit-dev.github.io/great-tables/b…

The biggest new feature is the addition of the `data_color()` method, which unlocks more possibilities for table presentation!

[RELEASE, BLOG POST] Great Tables `v0.2.0` is now released on PyPI! We wrote a blog post about it here: posit-dev.github.io/great-tables/b… The biggest new feature is the addition of the `data_color()` method, which unlocks more possibilities for table presentation!
account_circle
The {gt}/great_tables Packages(@gt_package) 's Twitter Profile Photo

gt `0.10.1` is out now! It contains all sorts of improvements to nanoplots (single bars! box plots!) as well as fixes to make everything just a little bit nicer. Release notes here: github.com/rstudio/gt/rel…

account_circle
Emily Riederer(@EmilyRiederer) 's Twitter Profile Photo

If you know me, you probably know my fixation on column names and column selectors for data wrangling, docs, and validation

I had NOT thought about selectors for styling. Awesome blog post on the deep integration of these features in The {gt}/great_tables Packages and polars data

account_circle
The {gt}/great_tables Packages(@gt_package) 's Twitter Profile Photo

[BLOG POST]
Styling tables is super important. Thankfully, Polars makes styling tables easy!

* ䷖ Polars selectors: choose columns for styling.
* 🎯Polars expressions: zero in on specific rows to highlight.
* 🎨 It’s easy to color cells based on data.

posit-dev.github.io/great-tables/b…

account_circle
The {gt}/great_tables Packages(@gt_package) 's Twitter Profile Photo

[NEW FEATURES]
PR#1527 (github.com/rstudio/gt/pul…) adds in box plots as a type of nanoplot. The box plots are laid out horizontally to conserve space and they can be compared across rows. Documentation for `cols_nanoplot()` (gt.rstudio.com/reference/cols…) contains a nice new example.

account_circle
Edit Gyenge(@edit_gyenge) 's Twitter Profile Photo

2023 has been a year of complex layers. From crafting infographics to tackling interactive projects, it's more than just visuals. It's juggling styles, stories, data types, deadlines, budgets, and feedback. Not easy, but worth it!

account_circle
Andrew Weatherman(@andreweatherman) 's Twitter Profile Photo

Learn how to create these cool game performance tables using The {gt}/great_tables Packages + cbbdata and cbbplotR on my blog!

If you find it valuable, please consider dropping a free subscription! It helps me gauge what content is useful.

open.substack.com/pub/aweatherma…

Learn how to create these cool game performance tables using @gt_package + cbbdata and cbbplotR on my blog! If you find it valuable, please consider dropping a free subscription! It helps me gauge what content is useful. open.substack.com/pub/aweatherma…
account_circle
The {gt}/great_tables Packages(@gt_package) 's Twitter Profile Photo

[BLOG POST]
First Great Tables blogpost on the project site! It shows you how to:
•configure the structure of the table (+ add source notes)
•format table-cell values
•add styling to targeted table cells (w/ Polars niceties)

Check it out at: posit-dev.github.io/great-tables/b…

account_circle
Grant Chalmers(@GrantChalmers) 's Twitter Profile Photo

2023 median CO2 intensity (gCO2eq/kWh) and power consumption breakdown (%). Data via Electricity Maps
table via R {gt} package.
visualisation
Methodology: electricitymaps.com/methodology
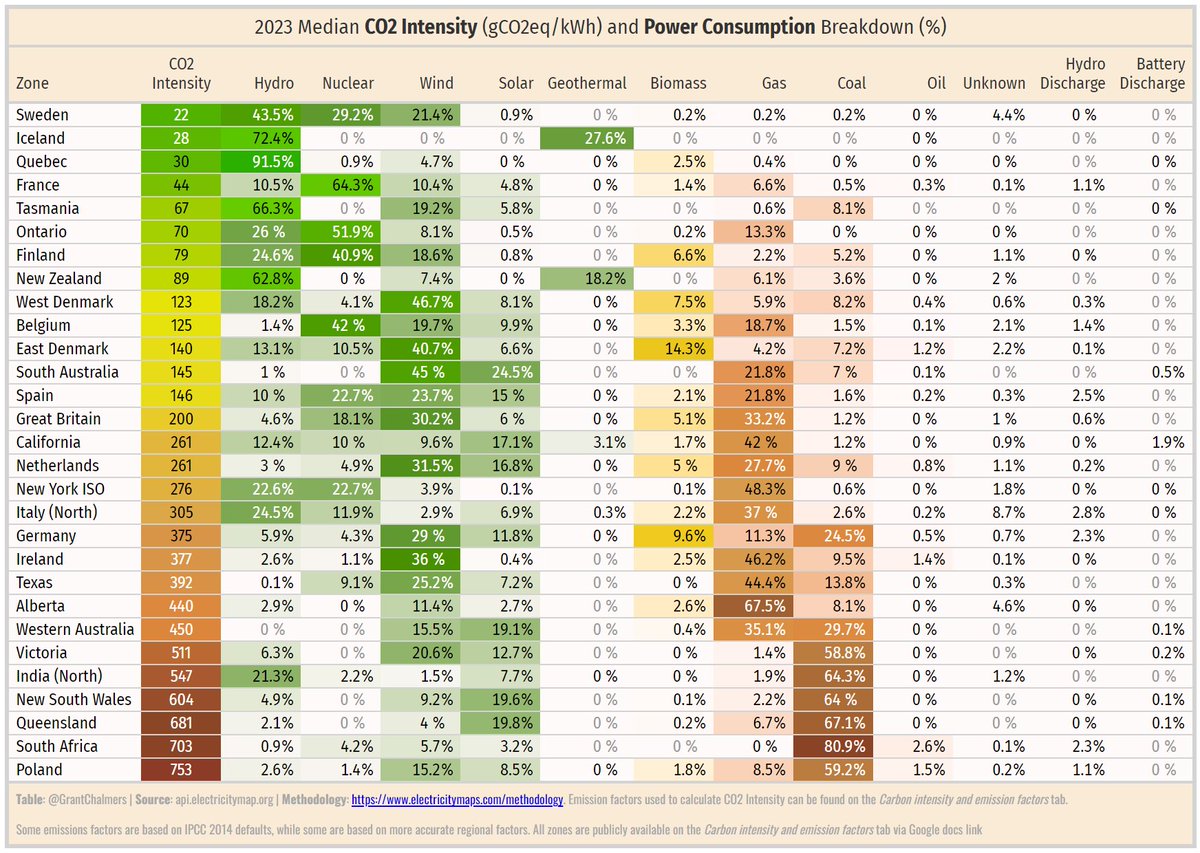
2023 median CO2 intensity (gCO2eq/kWh) and power consumption breakdown (%). Data via @ElectricityMaps table via R {gt} package. #rstats #gt #energy #EnergyTransition #electricity #data #datavisualisation Methodology: electricitymaps.com/methodology
account_circle