Ryan Burge πŸ“Š(@ryanburge) 's Twitter Profileg
Ryan Burge πŸ“Š

@ryanburge

Teach: @eiu | Research Director: @myfaithcounts | Books: The Nones & 20 Myths | Pastor: @AmericanBaptist | Graphs about Religion

ID:14851168

linkhttps://linktr.ee/RyanBurge calendar_today21-05-2008 02:19:07

7,8K Tweets

24,3K Followers

184 Following

Ryan Burge πŸ“Š(@ryanburge) 's Twitter Profile Photo

Here's a big warning sign for the future of evangelicalism.

Since 1900, the share of people who were currently evangelical was larger than the share who were raised evangelical.

That means evangelicals were converting non-evangelicals.

That trend stopped ~15 years ago.

Here's a big warning sign for the future of evangelicalism. Since 1900, the share of people who were currently evangelical was larger than the share who were raised evangelical. That means evangelicals were converting non-evangelicals. That trend stopped ~15 years ago.
account_circle
Ryan Burge πŸ“Š(@ryanburge) 's Twitter Profile Photo

The share who say both:
Religion is very important to me AND
I attend religious services seldom/never

2008 vs 2022, by political party:
Democrats: 6.5% -> 6.5%
Independent: 7.5% -> 9%
Republicans: 5% -> 11%

The share who say both: Religion is very important to me AND I attend religious services seldom/never 2008 vs 2022, by political party: Democrats: 6.5% -> 6.5% Independent: 7.5% -> 9% Republicans: 5% -> 11%
account_circle
Ryan Burge πŸ“Š(@ryanburge) 's Twitter Profile Photo

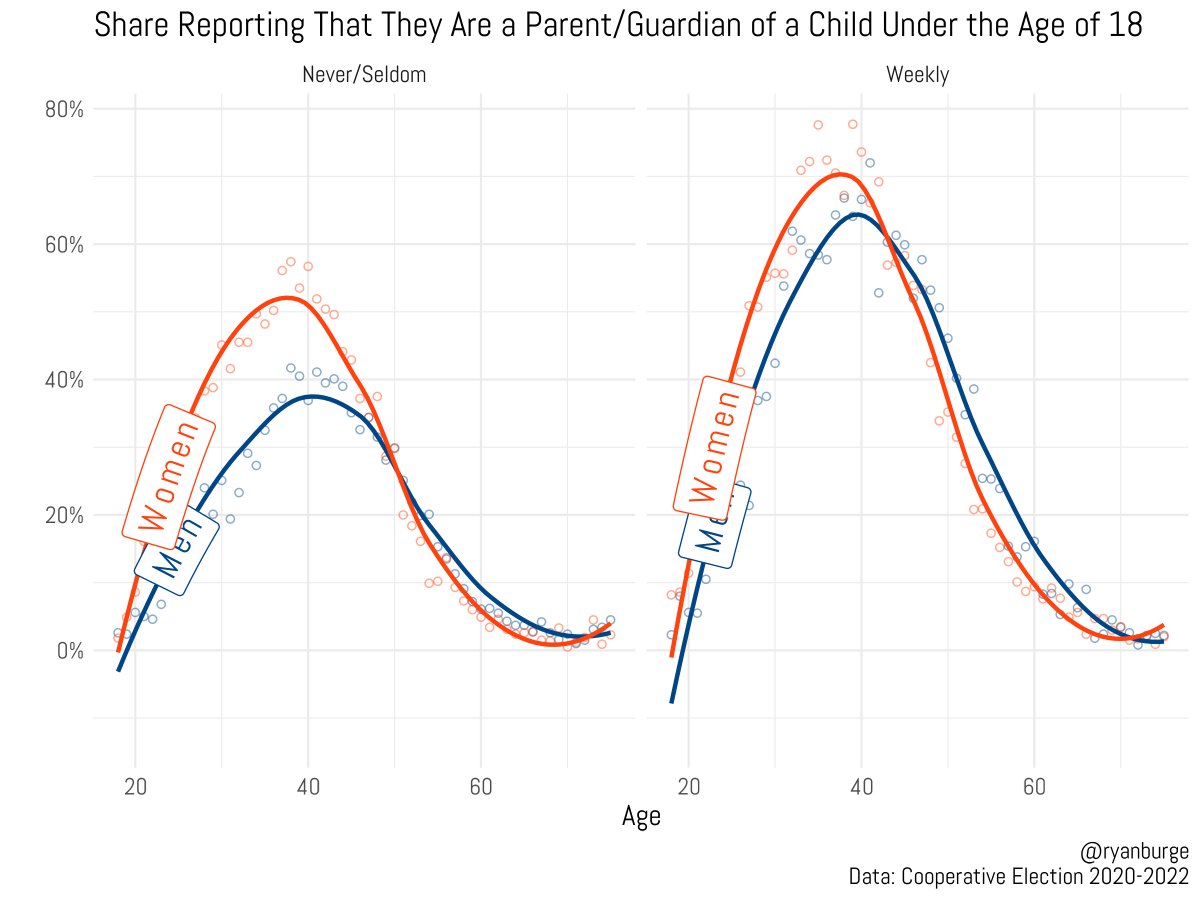
Among 40 year old men who attend religious services less than once a year: 38% are currently parents to young children.

Among 40 year old men who attend services weekly: 63% are parents to young children.

Among 40 year old men who attend religious services less than once a year: 38% are currently parents to young children. Among 40 year old men who attend services weekly: 63% are parents to young children.
account_circle
Ryan Burge πŸ“Š(@ryanburge) 's Twitter Profile Photo

I'm fascinated by people who say:

Religion is very important
I attend religious services less than once a year

What factors lead people to fit this criteria?

Being older.
Being politically conservative.

More πŸ‘‡πŸ‘‡πŸ‘‡

graphsaboutreligion.com/p/religions-im…

account_circle
Ryan Burge πŸ“Š(@ryanburge) 's Twitter Profile Photo

56% of Millennials had a certain belief in God in 1998. Today, it's 42%.

Among Gen Z, just 28% have a certain belief in God today.

For comparison, ~60% of Boomers and Gen X have a certain belief in God today.

That's largely unchanged since 1988.

56% of Millennials had a certain belief in God in 1998. Today, it's 42%. Among Gen Z, just 28% have a certain belief in God today. For comparison, ~60% of Boomers and Gen X have a certain belief in God today. That's largely unchanged since 1988.
account_circle
Ryan Burge πŸ“Š(@ryanburge) 's Twitter Profile Photo

The Republican vote share increased by at least one point in 85% of counties with a population <50K between 2000 and 2020.

The Democrats increased their vote share by at least one point in 78% of counties with a population of >250K between 2000 and 2020.

The Republican vote share increased by at least one point in 85% of counties with a population <50K between 2000 and 2020. The Democrats increased their vote share by at least one point in 78% of counties with a population of >250K between 2000 and 2020.
account_circle
Ryan Burge πŸ“Š(@ryanburge) 's Twitter Profile Photo

I shot a straight line through the membership stats of the United Methodist Church, starting in 1967 and extending it through 2050.

It predicted that the UMC would hit 4.9 million members in 2038.

Instead, they hit that number in 2023.

That's the fall out of the schism.

I shot a straight line through the membership stats of the United Methodist Church, starting in 1967 and extending it through 2050. It predicted that the UMC would hit 4.9 million members in 2038. Instead, they hit that number in 2023. That's the fall out of the schism.
account_circle
Ryan Burge πŸ“Š(@ryanburge) 's Twitter Profile Photo

The median pay for clergy in 2022 was $55,550 according to data from the Bureau of Labor Statistics.

This doesn't include a housing allowance, which isn't considered income.

The median wage for all workers was just about the same: ~$55K

The median pay for clergy in 2022 was $55,550 according to data from the Bureau of Labor Statistics. This doesn't include a housing allowance, which isn't considered income. The median wage for all workers was just about the same: ~$55K
account_circle
Ryan Burge πŸ“Š(@ryanburge) 's Twitter Profile Photo

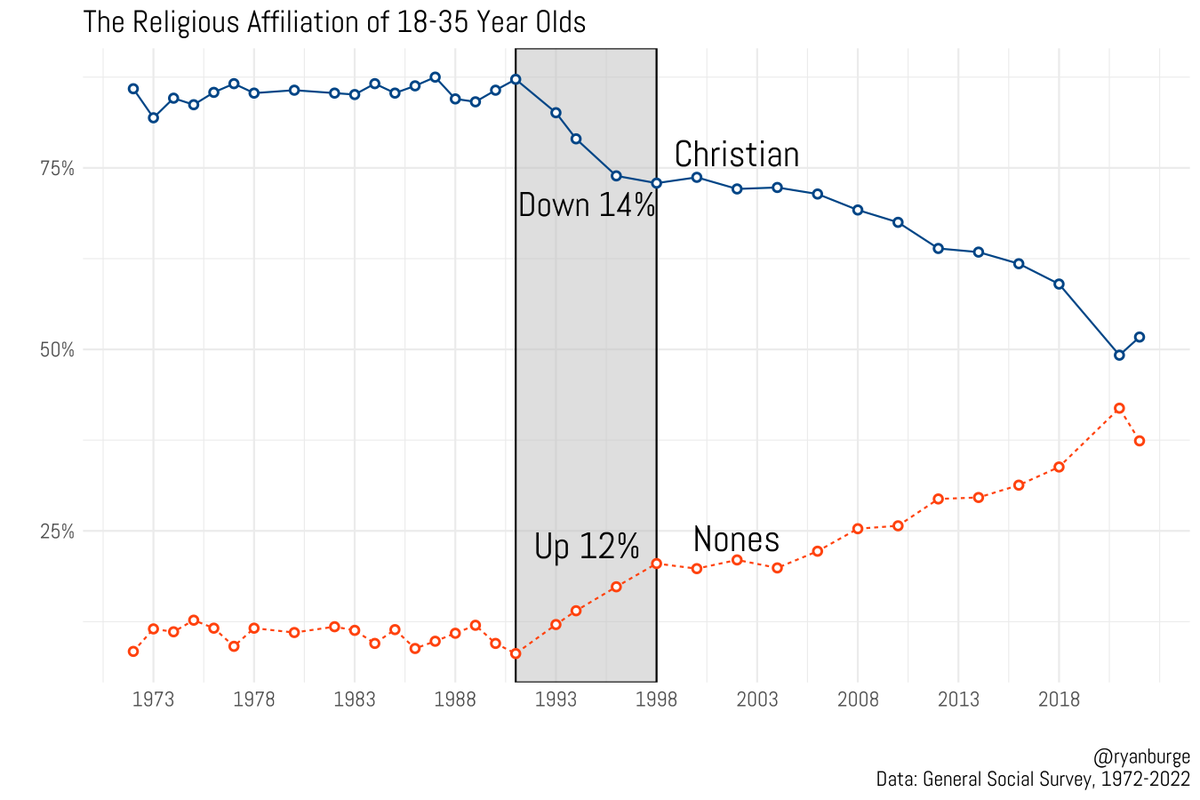
Among 18-35 year olds, their religious affiliation rapidly changed during a short window of time between 1991 and 1998.

87% were Christians in 1991. It was 73% in 1998.

Down 14 pts.

8% were nones in 1991. It was 20.5% in 1998.

Up 12 pts.

Among 18-35 year olds, their religious affiliation rapidly changed during a short window of time between 1991 and 1998. 87% were Christians in 1991. It was 73% in 1998. Down 14 pts. 8% were nones in 1991. It was 20.5% in 1998. Up 12 pts.
account_circle
Ryan Burge πŸ“Š(@ryanburge) 's Twitter Profile Photo

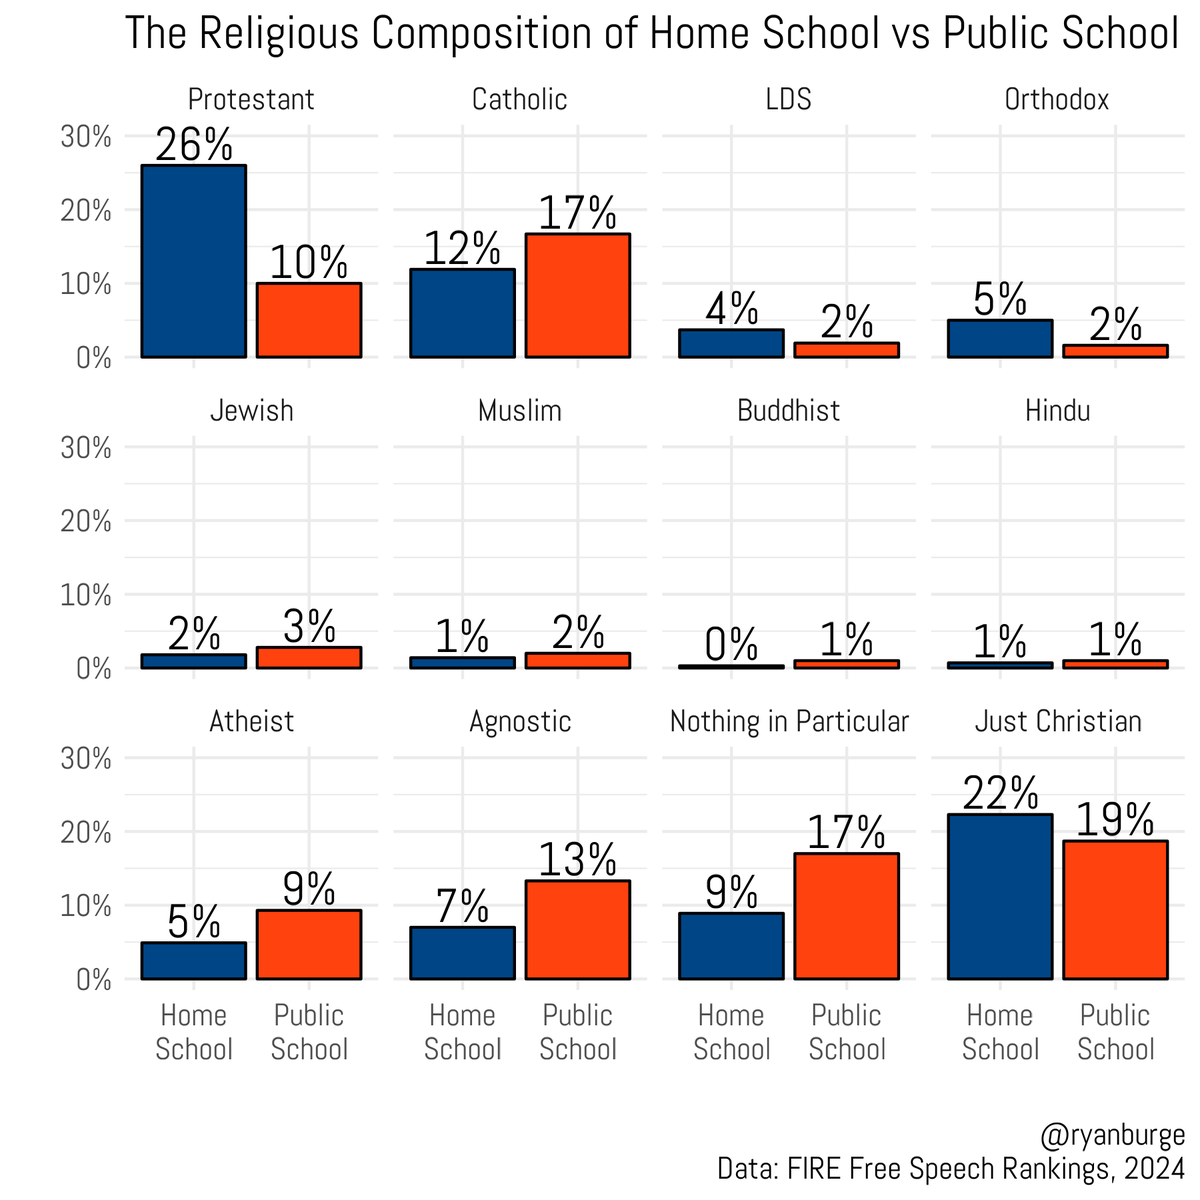
Among college students who were homeschooled:

62% were raised Christian.
21% were raised with no religion.

Among college students who went to public school:

48% were raised Christian.
39% were raised with no religion.

Among college students who were homeschooled: 62% were raised Christian. 21% were raised with no religion. Among college students who went to public school: 48% were raised Christian. 39% were raised with no religion.
account_circle
Ryan Burge πŸ“Š(@ryanburge) 's Twitter Profile Photo

Partisanship of Latter-day Saints, by age:

60 year olds:
Republican - 70%
Democrat - 20%

40 year olds:
Republican - 60%
Democrat - 30%

20 year olds:
Republican - 50%
Democrat - 35%

Partisanship of Latter-day Saints, by age: 60 year olds: Republican - 70% Democrat - 20% 40 year olds: Republican - 60% Democrat - 30% 20 year olds: Republican - 50% Democrat - 35%
account_circle
Ryan Burge πŸ“Š(@ryanburge) 's Twitter Profile Photo

The peak of religious importance among high school seniors over the last five decades was in....

2001.

10% of them said religion was not important at all in 1976.

Today, it's 27%.

It became the most popular response option in the last five years.

The peak of religious importance among high school seniors over the last five decades was in.... 2001. 10% of them said religion was not important at all in 1976. Today, it's 27%. It became the most popular response option in the last five years.
account_circle
Ryan Burge πŸ“Š(@ryanburge) 's Twitter Profile Photo

William Jennings Bryan represented the state in the Scopes Monkey Trial, arguing for a literalist view of the Bible.

The case was decided on July 21, 1925.

Bryan died five days later.

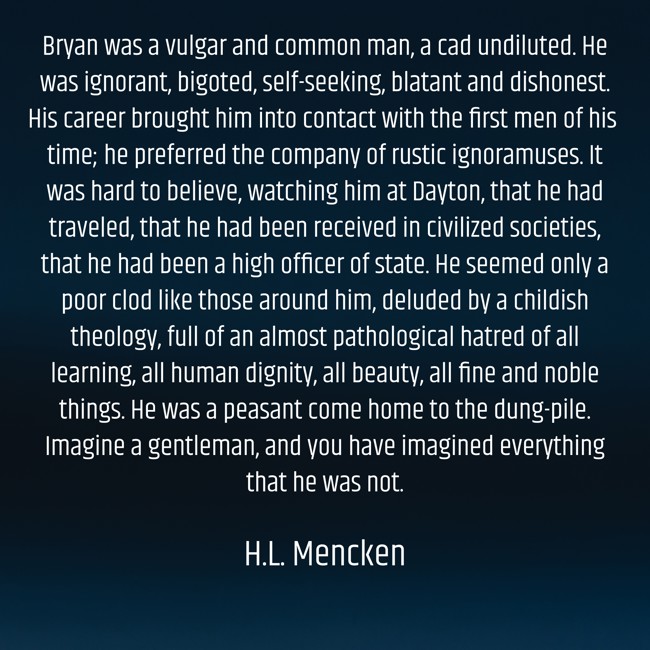
H.L. Mencken may have written the most savage obituary of all time.

An excerpt:

William Jennings Bryan represented the state in the Scopes Monkey Trial, arguing for a literalist view of the Bible. The case was decided on July 21, 1925. Bryan died five days later. H.L. Mencken may have written the most savage obituary of all time. An excerpt:
account_circle
Ryan Burge πŸ“Š(@ryanburge) 's Twitter Profile Photo

There are an increasing number of Americans who:

describe their religion as 'nothing in particular'
partisanship as independent/other
ideology as not sure
and have a low level of educational attainment.

They are just done - with everything.

graphsaboutreligion.com/p/dropping-out…

account_circle
Ryan Burge πŸ“Š(@ryanburge) 's Twitter Profile Photo

Here's Trump's vote share in the 20 largest majority white Protestant denominations in 2020.

He earned at least 55% of the vote in 12 of them.
He earned at least 47% in 19 of them.

There's only one denomination that was strongly for Biden - the Episcopal Church.

Here's Trump's vote share in the 20 largest majority white Protestant denominations in 2020. He earned at least 55% of the vote in 12 of them. He earned at least 47% in 19 of them. There's only one denomination that was strongly for Biden - the Episcopal Church.
account_circle
Ryan Burge πŸ“Š(@ryanburge) 's Twitter Profile Photo

Share of evangelicals who voted for Donald Trump in 2020, broken down by race:

White: 82%
Black: 16%
Hispanic: 47%
Asian: 54%

Among non-evangelicals:
White: 41%
Black: 6%
Hispanic: 26%
Asian: 23%

Share of evangelicals who voted for Donald Trump in 2020, broken down by race: White: 82% Black: 16% Hispanic: 47% Asian: 54% Among non-evangelicals: White: 41% Black: 6% Hispanic: 26% Asian: 23%
account_circle
Robert Downen(@RobertDownen_) 's Twitter Profile Photo

Interesting graph on belief in the Prosperity Gospel based on race/income, via Ryan Burge πŸ“Š
graphsaboutreligion.com/p/who-believes…
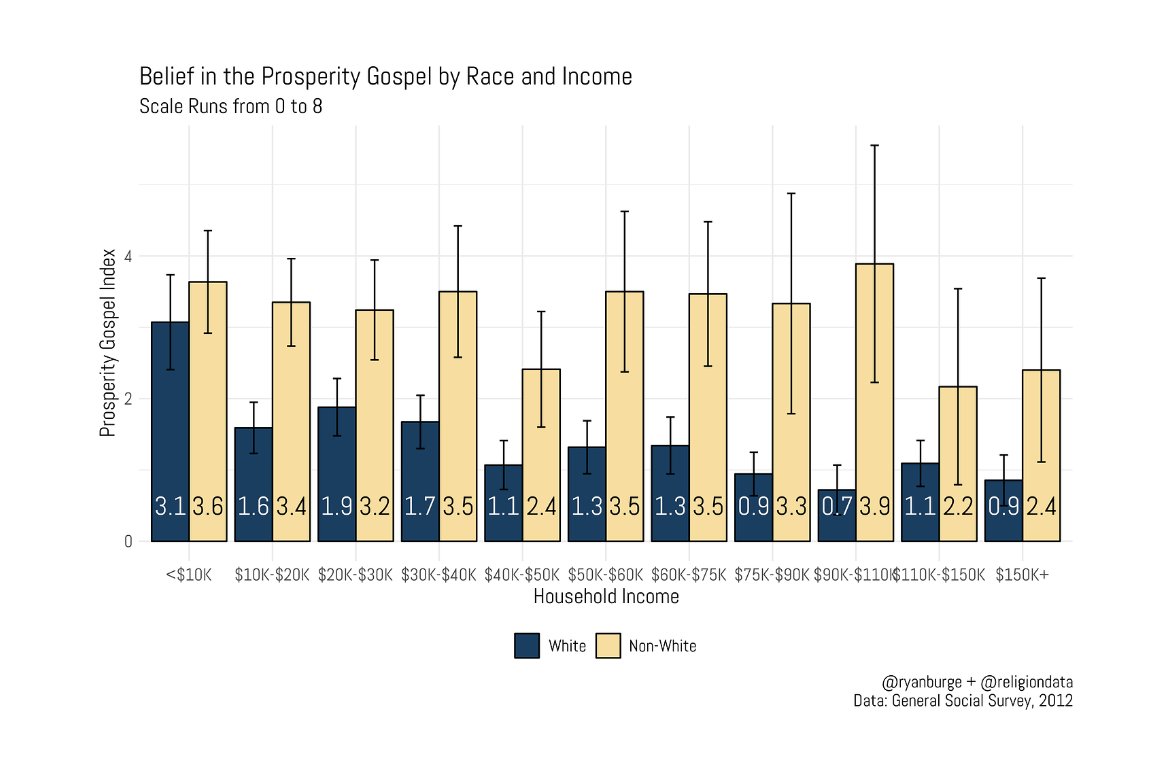
Interesting graph on belief in the Prosperity Gospel based on race/income, via @ryanburge graphsaboutreligion.com/p/who-believes…
account_circle