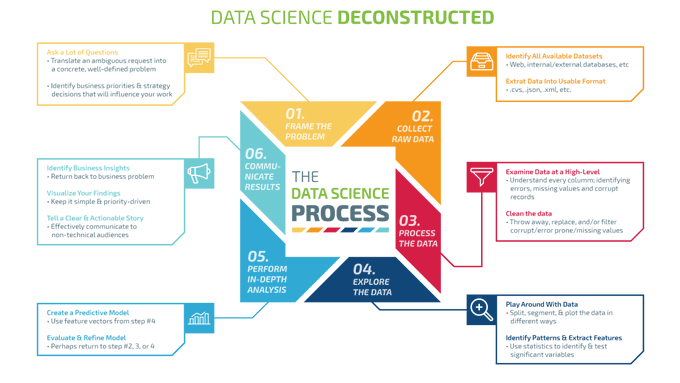
#Infographic : Learn about the Data Science process!
#ProblemDefinition #DataCollection #DataPreparation #DataExploration #FeatureEngineering #Modeling #ModelEvaluation #ModelDeployment #ModelMaintenance #DataScience


4/8 Pros of Power BI:
Interactive dashboards: Power BI's interactive dashboards allow users to explore data dynamically, drill down into details, and gain valuable insights quickly. #InteractiveDashboards #DataExploration

Unsupervised Machine Learning: The Power of Data without Labels
#UnsupervisedLearning #Clustering #DimensionalityReduction #FeatureExtraction #DataExploration #KMeansClustering #HierarchicalClustering #GaussianMixtureModels
informaticpoint.com/science-techno…

Having a curious mind is key to data exploration. Embrace a curious mindset, ask yourself questions, and let your data guide you to new discoveries and actionable insights. This an unspoken skill that many people will not tell you. #DataExploration #Datascience

Get a handle on data visualization and exploration by learning tools like Matplotlib, Seaborn, and ggplot. #DataVisualization #DataExploration #Matplotlib #Seaborn #ggplot

Stay curious and explore diverse data sources beyond your comfort zone. Cross-disciplinary analysis often uncovers unexpected connections and insights. #Curiosity #DataExploration #AnalyticalThinking

Understanding statistical analysis 📊🔍
Statistical analysis involves exploring and summarizing data to uncover patterns and relationships.
Learn essential statistical concepts, descriptive statistics, and data distributions in R.
#StatisticalAnalysis #DataExploration

Interactive dashboards allow users to explore data and drill down into specific areas of interest.
#Dashboards #DataExploration


📊 ExcelGPT Use Cases 🧵
1️⃣ Data Exploration: Easily analyze and explore large datasets by asking questions about the data structure, trends, patterns. #DataExploration

👏 Lime is hiring a remote Staff Software Engineer - Backend #Lime #remotework #remotejob #workfromhome #SoftwareDevelopment #CloudInfrastructure #DataExploration himalayas.app/companies/lime…

Fishy Data Analysis. A nice example on how to apply R skills to perform initial data analysis on a real-world dataset.
youtu.be/sQNQ-jvx8EU
#DataAnalysis #Bioinformatics #DataExploration #RProgramming #Statistics

In this article, we’re going to cover 11 data exploration tools that are specifically designed for exploration and analysis. #DataScience #DataExploration hubs.li/Q01BPvYw0

Step 8️⃣: Interact with your report Now comes the exciting part! Interact with your Power BI report directly within Jupyter Notebook. Explore the visualizations, apply filters, and gain deeper insights into your data. 🔄🔍 #DataExploration


RT Netflix Case Study (EDA): Unveiling Data-Driven Strategies for Streaming #Advanced #Bigdata #DataAnalysis #DataExploration #DataVisualization dlvr.it/Spzy2W


5 Powerful Python Libraries For EDA You Need to Know About bit.ly/3IyzHwi
#optimumfuturist #pythonlibraries #datascience #EDA #pandas #numpy #matplotlib #seaborn #scipy #statsmodels #scikit -learn #dataanalysis #dataexploration #jupyter #pythonprogramming #pythoncode


In addition to bar and line graphs, Matplotlib allows you to create heat maps, scatter plots, and other types of visualizations to explore your data. #DataExploration #DataVisualization

2/ Visualizing data allows us to explore patterns and trends that may not be immediately apparent in raw numbers. It brings data to life and helps us uncover valuable insights. #DataExploration #DataAnalysis


Have you ever wondered about where to begin with data cleaning, how to ensure data is ready for analysis, or how to make your findings reproducible? Join Bianca Manago for Data Cleaning on June 13-16 to learn the answers to these questions & more!