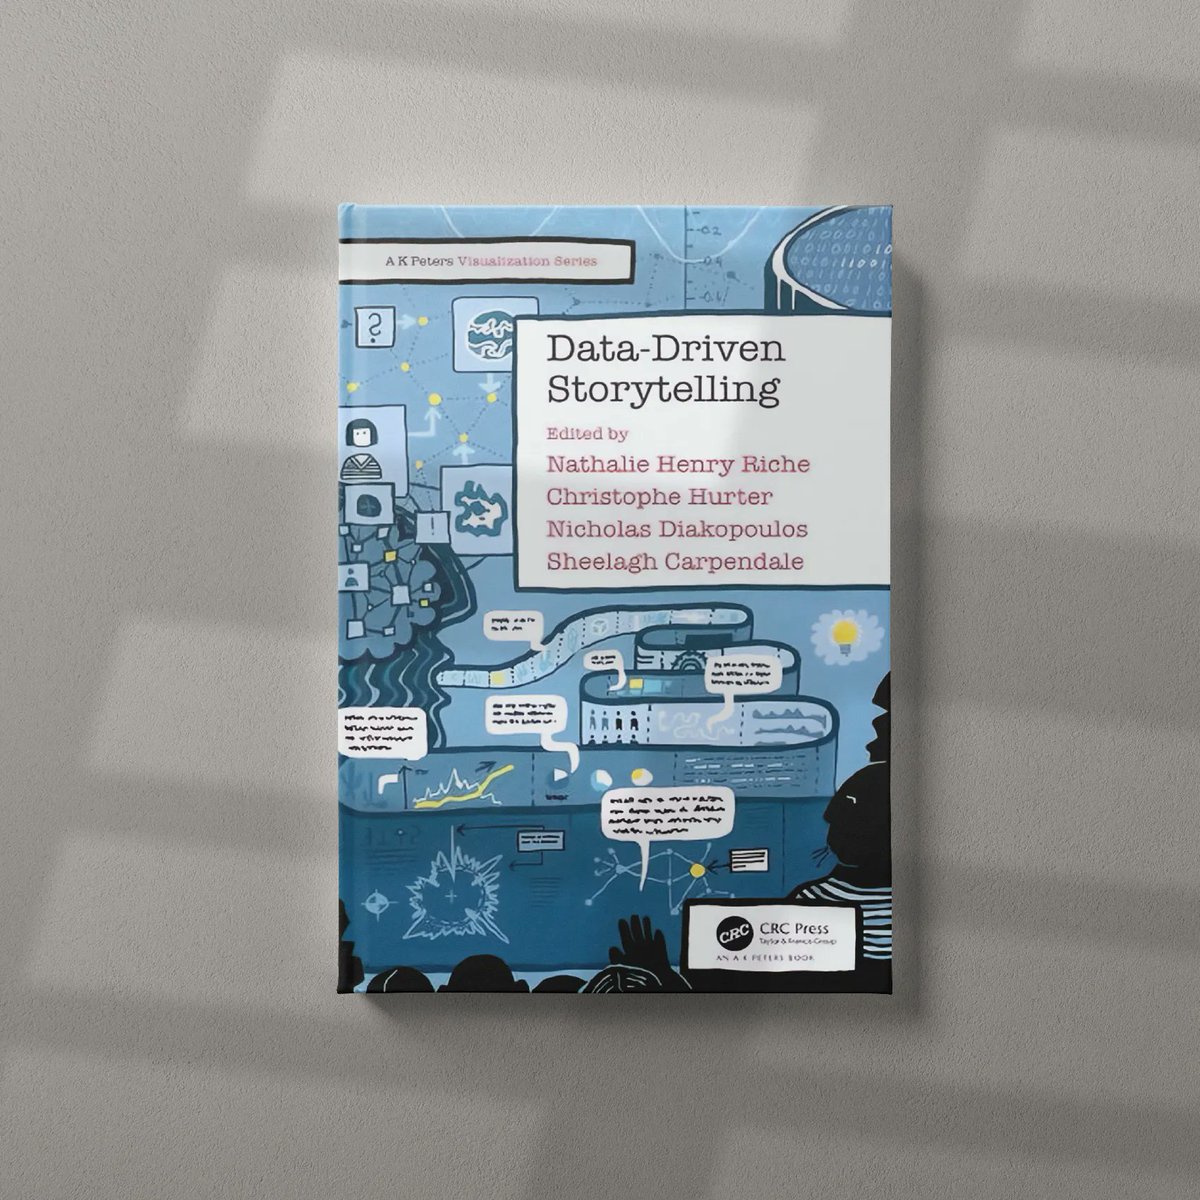
Data Storytelling morioh.com/a/6d43d951a90f…
#data #data storytelling #data analytics #data science #machinelearning #deeplearning #ai #artificialintelligence #programming #developer #morioh #softwaredeveloper #computerscience #calculus #linearalgebra #python
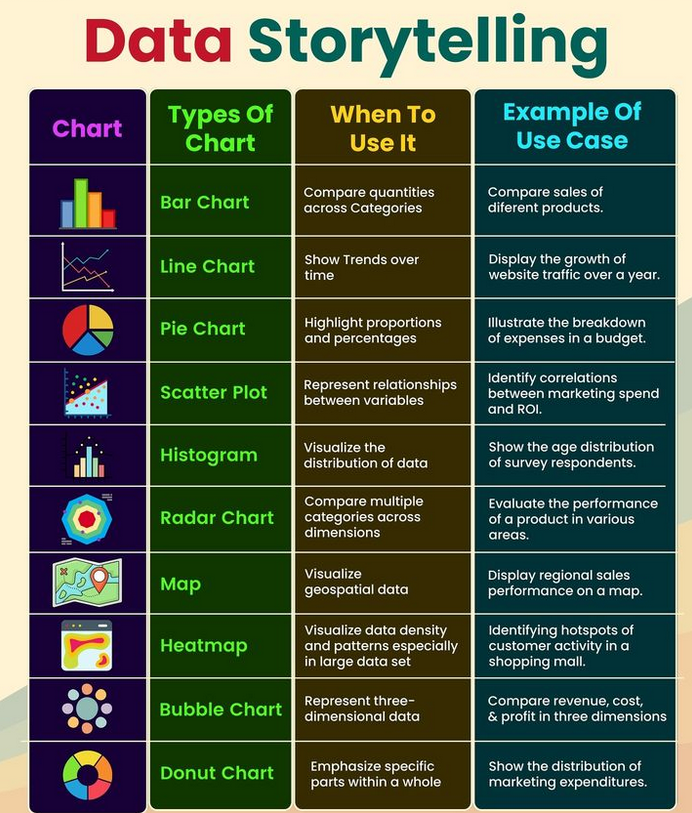

Embark on a fascinating journey into the realm of data science in R with this comprehensive guide designed for social scientists. 🔗Free pdf: pyoflife.com/doing-data-sci…
#DataScience #r stats #DataScientists #datastorytelling #datavisualization #r #programming #Database #coding

With Gitrevio's advanced visualization, check out trends, patterns, and resource allocation like never before, and make informed decisions effortlessly.
#Gitrevio #DataStorytelling #Visualization

💡 An overview of data storytelling: hubs.ly/Q02czZsx0
#datastorytelling #datascience #datavisualization


Hello Techies 😎
Data speaks volumes, but stories give it meaning. By weaving narratives around data, storytellers can convey the significance and implications of the data in a way that resonates with their audience.
#data #analytics #data storytelling #learntechterms #tech

R programming language has become a powerhouse in modern data science and statistical computing. pyoflife.com/modern-r-progr…
#DataScience #r stats #DataAnalytics #DataStorytelling #DataScientist #r #programming #statistics #MachineLearning #mathematics #DataVisualization #coding


📣 Now in print! 📣
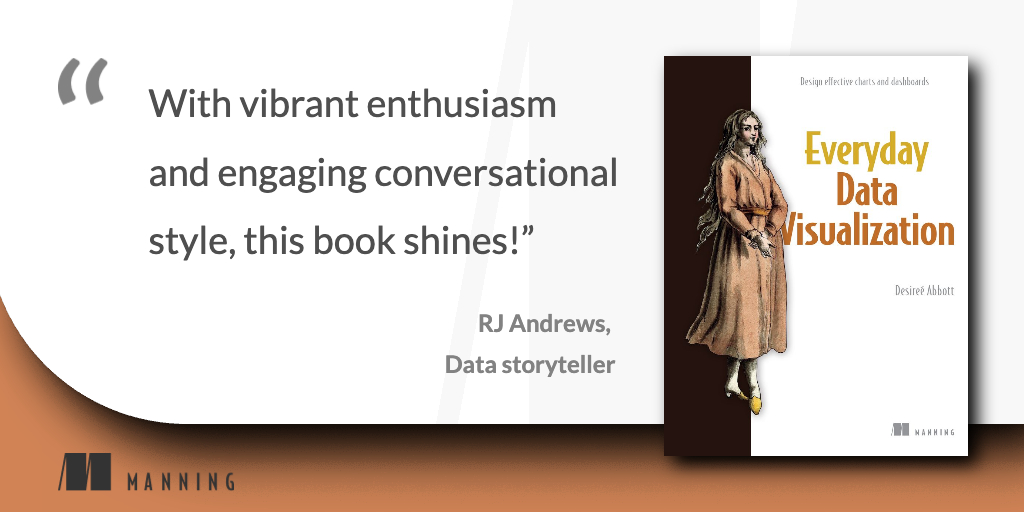
Everyday Data Visualization by Desireé Abbott (she/her).
mng.bz/ZEMP
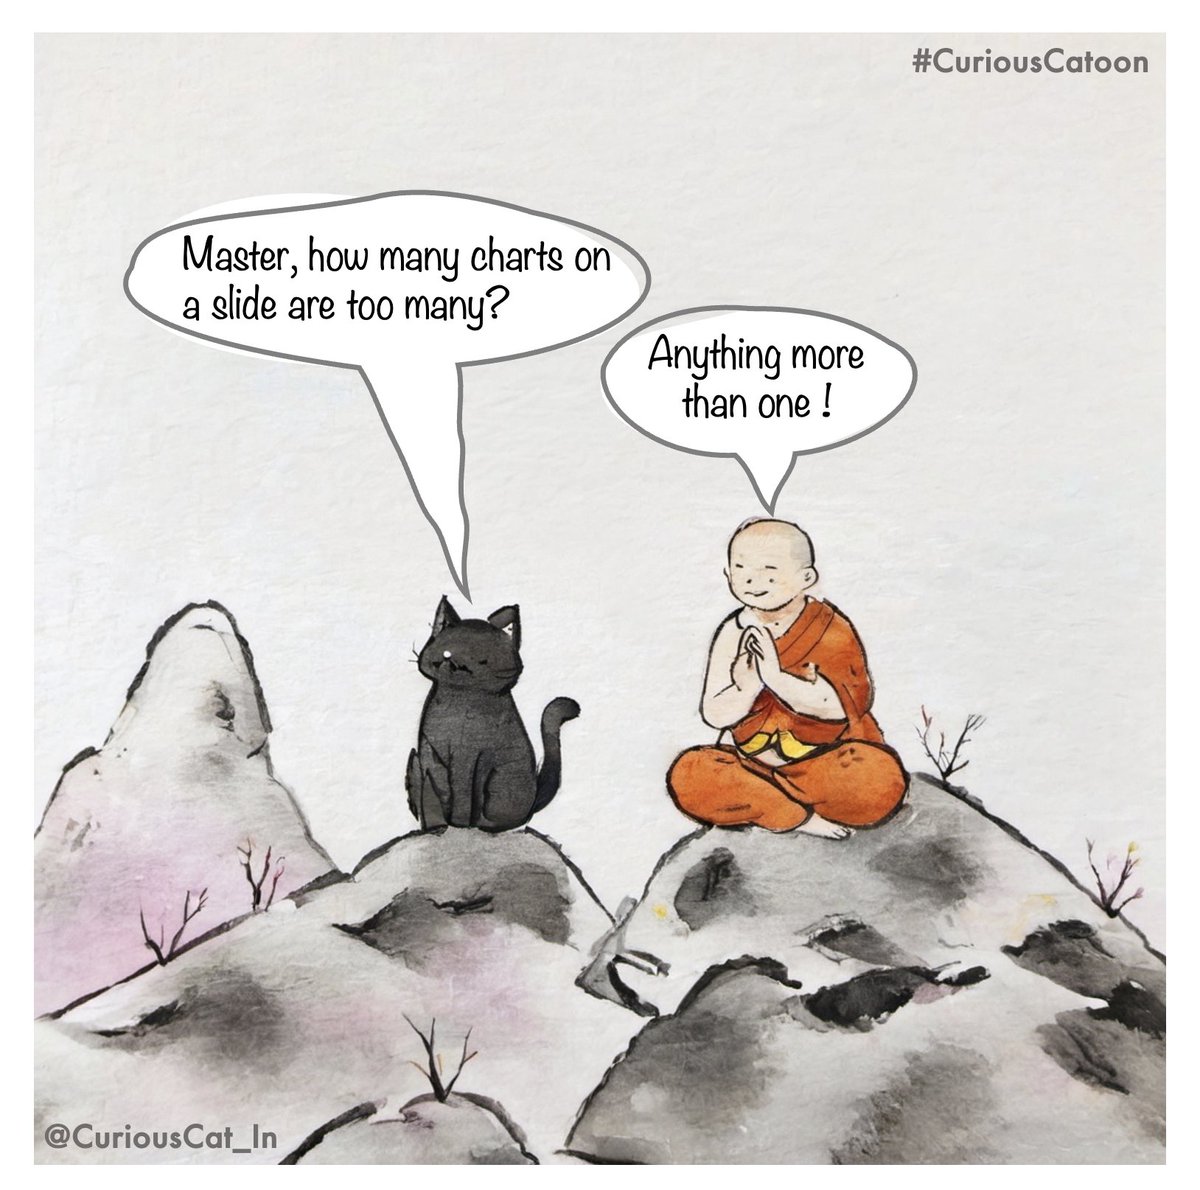
📚 Improve the quality of your #dataviz by employing principles of color, typography, chart types, #datastorytelling , and more. 📚
Thank you for the quote, RJ Andrews.
#ManningBooks

Discover how #Microsoft crafted the perfect recipe for successful report creation with Zebra BI. This infographic illustrates the seven pivotal steps to transform their #datastorytelling .
🔗 Read the full story here (video also available): bit.ly/48MJ32E


👉 An overview of data storytelling: hubs.la/Q02dS4Sx0
#datastorytelling #datavisualization #datascience


📊 📚Wondering about tools for data-driven stories? MediaNumeric chatted with industry experts about what tools to use for crafting data tales! 🕵️♀️Dive into our ‘shopping list’ of tools & platforms to rock your own stories!⤵️ #DataStorytelling #DataTools #DataJournalism


We rely on data to tell us what has happened, and stories to tell us what it means. #datastorytelling

#Data Storytelling in #PowerPoint and #PowerBI just got a whole lot cooler!
Want to see how you can keep your dashboard LIVE and AUTOMATICALLY refreshing?
Want to see how you can use AI to enhance the narrative around your #Data in your decks?
Check out my latest video that…


📊 Dive into the world of data storytelling with us! In today's data-driven landscape
Learn more: computertrainingwales.co.uk/courses/ai-cou…
Join our course to master the art of transforming numbers into captivating stories that leave a lasting impact
#DataStorytelling #DataAnalysis

#upskillintech I'm super excited to start learning #DataAnalysis through the .Zindua School & YoungTechiez #30daychallenge ! This boot camp will equip me with the fundamentals of #Tableau , #SQL & #DataStoryTelling

Zapraszam firmy i instytucje do współpracy i na moje szkolenie „Data storytelling – jak skutecznie interpretować, wizualizować i komunikować liczby oraz dane”.
#szkolenie #datastorytelling #ciekaweliczby
alicjadefratyka.pl/wspolpraca/


