I love that there are folks who’ve never used the tidyverse but want to help recreate it in #JuliaLang .


How to extract the coordinates of a regression line in a ggplot2 plot in the R programming language: statisticsglobe.com/extract-stat_s…
#VisualAnalytics #StatisticalAnalysis #ggplot2 #RStats #coding #tidyverse


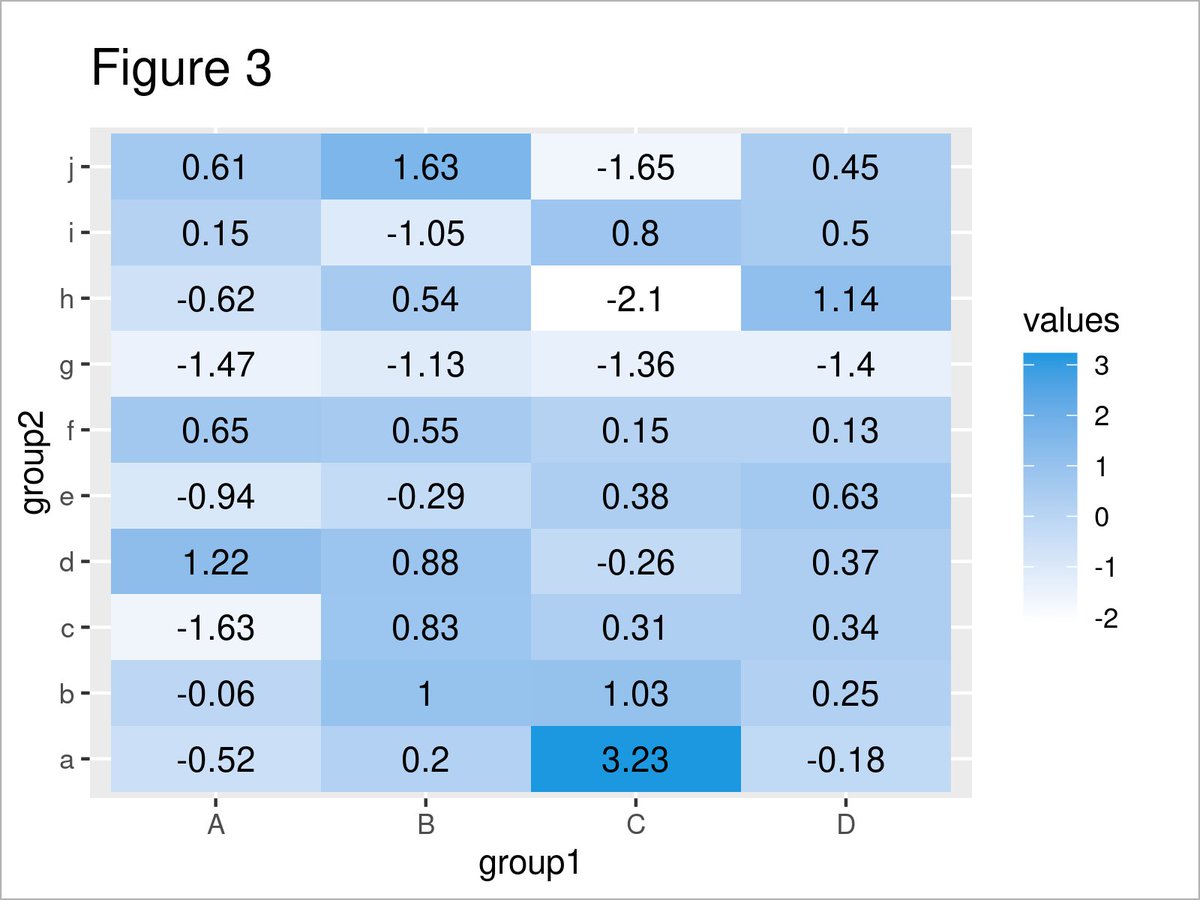
How to draw a heatmap with values using the ggplot2 package in the R programming language: statisticsglobe.com/add-values-hea…
#DataVisualization #VisualAnalytics #DataScience #RStats #tidyverse

Attn #statstwitter : New courses this summer! Join Interactive Visual Dashboards w/ #RShiny , Unsupervised Statistical Learning w/ #Python , or Data Analysis w/ ChatGPT: Promise & Pitfalls. Plus returning faves on #DAGs , #machinelearning , #tidyverse , & more. bit.ly/3wdWfjF


How to draw labels at the end of each line of a line plot using the ggplot2 and ggrepel packages in the R programming language: statisticsglobe.com/add-labels-at-…
#tidyverse #RStats #DataVisualization #DataViz #ggplot2


[RECURSO 📚] - ¿Sos del equipo de las Ciencias Sociales y querés aprender a programar con R por tu cuenta? Pasá por este curso abierto y gratuito donde aprenderás R base + tidyverse + visualización de datos y generación de reportes
🌐 intro-r-eph.netlify.app
✍🏼 Pablo_te ⭐️⭐️⭐️ @[email protected]
![Estación R (@estacion_erre) on Twitter photo 2024-04-22 13:18:17 [RECURSO 📚] - ¿Sos del equipo de las Ciencias Sociales y querés aprender a programar con R por tu cuenta? Pasá por este curso abierto y gratuito donde aprenderás R base + tidyverse + visualización de datos y generación de reportes
🌐 intro-r-eph.netlify.app
✍🏼 @pabblo_h [RECURSO 📚] - ¿Sos del equipo de las Ciencias Sociales y querés aprender a programar con R por tu cuenta? Pasá por este curso abierto y gratuito donde aprenderás R base + tidyverse + visualización de datos y generación de reportes
🌐 intro-r-eph.netlify.app
✍🏼 @pabblo_h](https://pbs.twimg.com/media/GLxaAXrbwAApaEQ.jpg)

How to merge data frames using the bind_rows & bind_cols functions of the dplyr package in R: statisticsglobe.com/r-bind_rows-bi…
#Data #datascienceeducation #database #RStats #Statistics #tidyverse


How to draw a ggplot2 barchart that shows the mean of each group in the R programming language: youtu.be/IFA4dIMTQXs
#ggplot2 #DataViz #RStats #Rpackage #tidyverse #VisualAnalytics

Frank Harrell Daniël Lakens 4. Statistical Modeling, Causal Inference, and Social Science. Andrew Gelman et al. buff.ly/2LsqBpA
5. Tidyverse Blog. buff.ly/3Q47NN3
6. RStudio Community. buff.ly/2MLdMDZ
7. Posit PBC Blog. buff.ly/49RvBuV
8. Datamethods. buff.ly/4cWvf8H


