Mark Z. Jacobson(@mzjacobson) 's Twitter Profile Photo

At this Contra Costa County meeting

sunflower-alliance.org/hot-debate-on-…

I said a CCS project is a waste b/c a fossil gas elec plant proposed for capture might not be here in 4-7 y since CA should be 100% by then

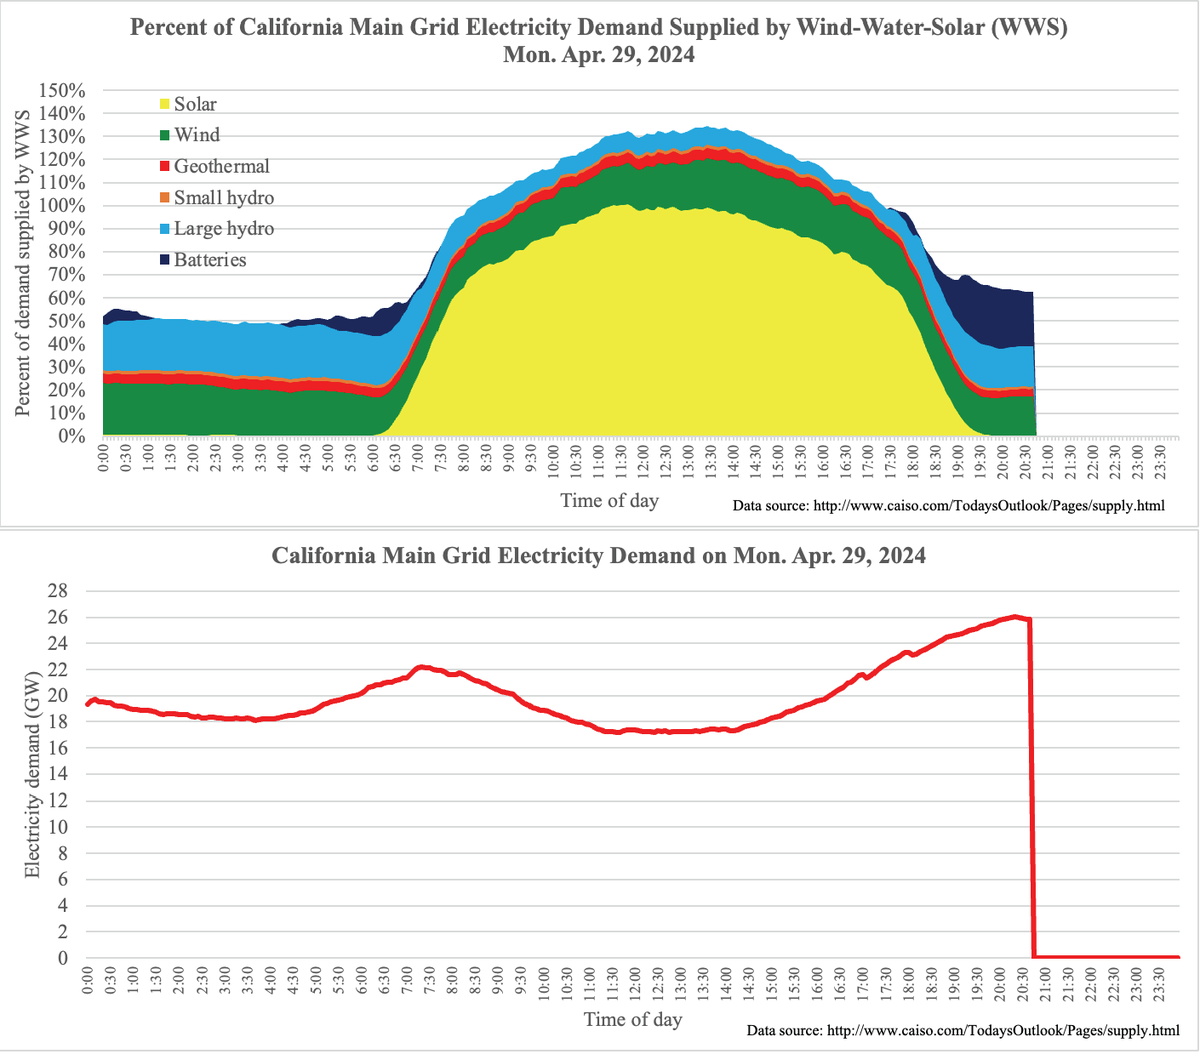
Today: 45th of 53 days & 16th in a row WWS>100% (for 9 h); peak: 134.5%

At this @CCCounty meeting

sunflower-alliance.org/hot-debate-on-…

I said a CCS project is a waste b/c a fossil gas elec plant proposed for capture might not be here in 4-7 y since CA should be 100% #WindWaterSolar by then

Today: 45th of 53 days & 16th in a row WWS>100% (for 9 h); peak: 134.5%
account_circle
BalThomass(@BalThomass) 's Twitter Profile Photo

Mike Hudema The photo shows solar panels. Half of these countries have no solar at all, the other half less than 1%. 6 out of 7 also don't have any wind. So the monicker WindWaterSolar is highly misleading, it's 100% hydro and geothermal (Iceland).

@MikeHudema The photo shows solar panels. Half of these countries have no solar at all, the other half less than 1%. 6 out of 7 also don't have any wind. So the monicker WindWaterSolar is highly misleading, it's 100% hydro and geothermal (Iceland).
account_circle
Mark Z. Jacobson(@mzjacobson) 's Twitter Profile Photo

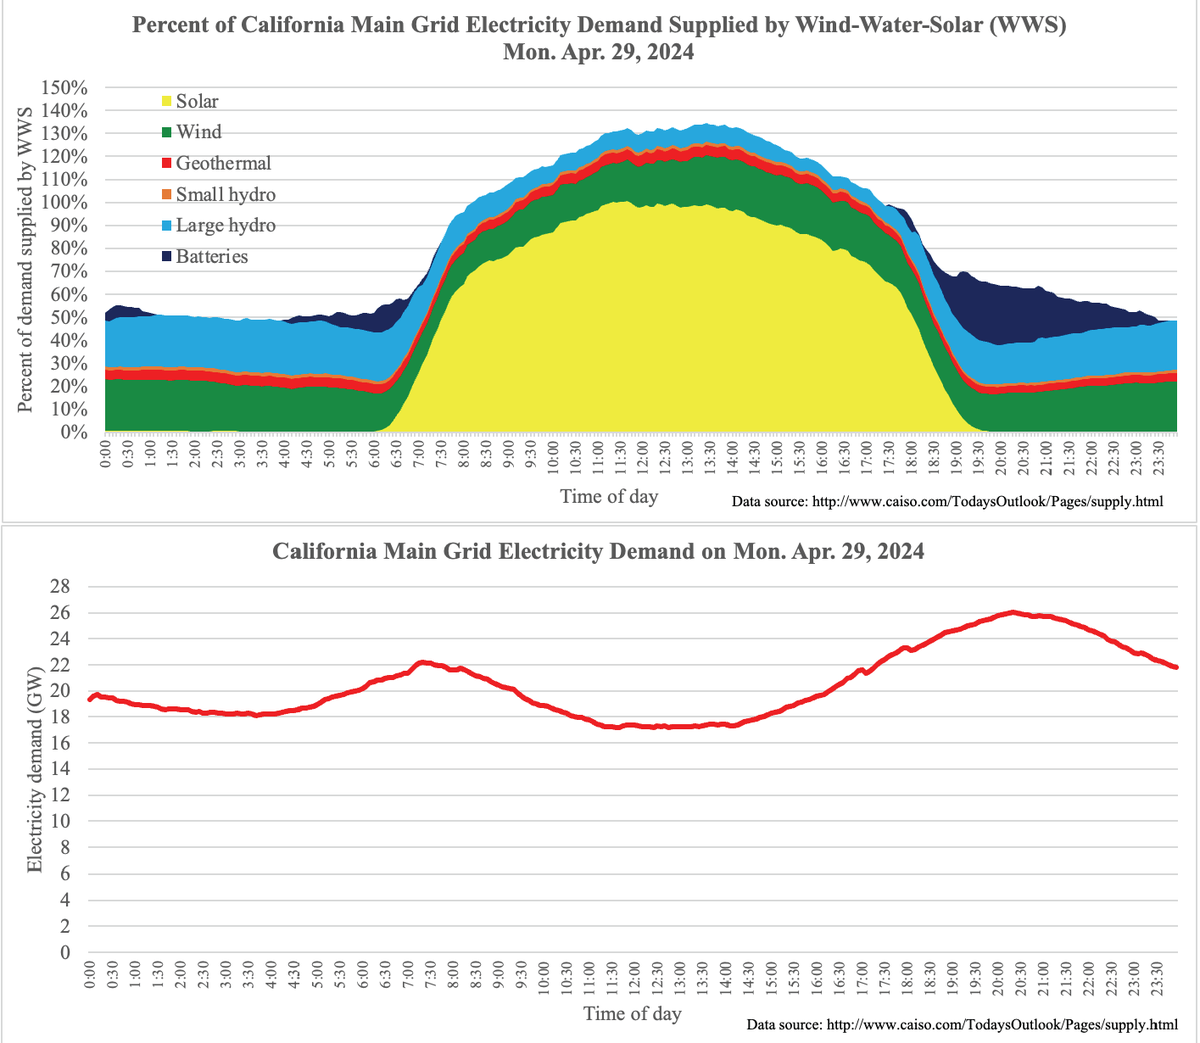
Two more records fall Mon, Apr 30 in Calif

1) 24-hour min reached 48.4% (prev record 47.7%)

2) Peak battery output rose to 6.76 GW (prev record 6.52 GW)

Also, peak WWS: 134.5% of demand
24-h avg WWS: 79.2% of demand
Batteries shifted 4.4% electricity to night
Two more records fall Mon, Apr 30 in Calif

1) 24-hour min #WindWaterSolar reached 48.4% (prev record 47.7%)

2) Peak battery output rose to 6.76 GW (prev record 6.52 GW)

Also, peak WWS: 134.5% of demand
24-h avg WWS: 79.2% of demand
Batteries shifted 4.4% electricity to night
account_circle
Mark Z. Jacobson(@mzjacobson) 's Twitter Profile Photo

April closes with another nearly-perfect 100% day.

For 27 of 30 days in April, and the last 17 days straight (and 46 of last 54 days), supply has exceeded demand for 0.25-9.92 h.

Today, WWS exceeded 100% for 8.5 h, peaking at 132.9%

April closes with another nearly-perfect 100% #WindWaterSolar day.

For 27 of 30 days in April, and the last 17 days straight (and 46 of last 54 days), #WWS supply has exceeded demand for 0.25-9.92 h. 

Today, WWS exceeded 100% for 8.5 h, peaking at 132.9%
account_circle
Mark Z. Jacobson(@mzjacobson) 's Twitter Profile Photo

supplied a 24-hour AVERAGE of 75.2% of Calif grid demand for last 10 days (4/19-4/28).

Batteries shifted 3.7% of that supply from day to night and set new record, discharging 6.523 GW 4/27

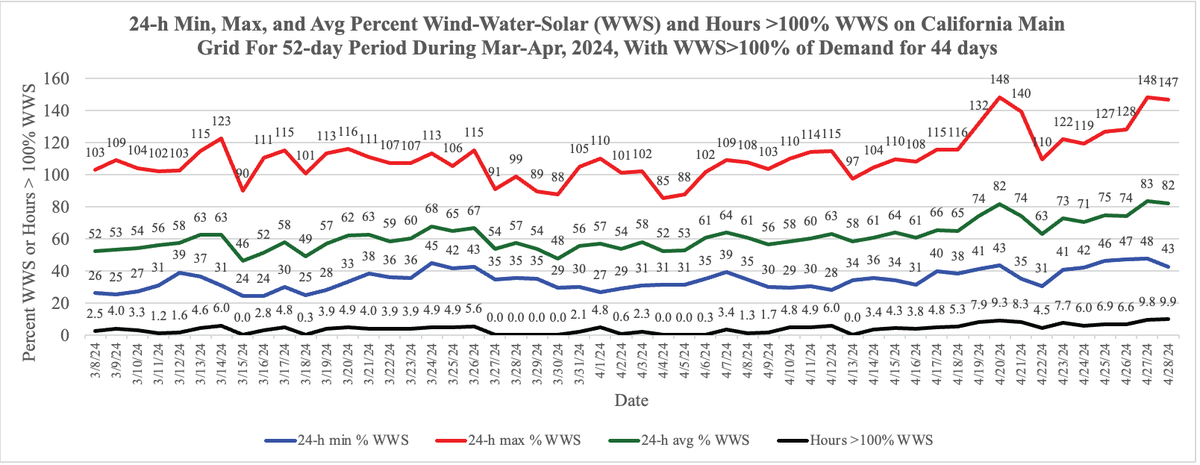
Full record 44 of 52 days WWS>100% demand
web.stanford.edu/group/efmh/jac…

#WindWaterSolar supplied a 24-hour AVERAGE of 75.2% of Calif grid demand for last 10 days (4/19-4/28).

Batteries shifted 3.7% of that #WWS supply from day to night and set new record, discharging 6.523 GW 4/27

Full record 44 of 52 days WWS>100% demand
web.stanford.edu/group/efmh/jac…
account_circle
Mark Z. Jacobson(@mzjacobson) 's Twitter Profile Photo

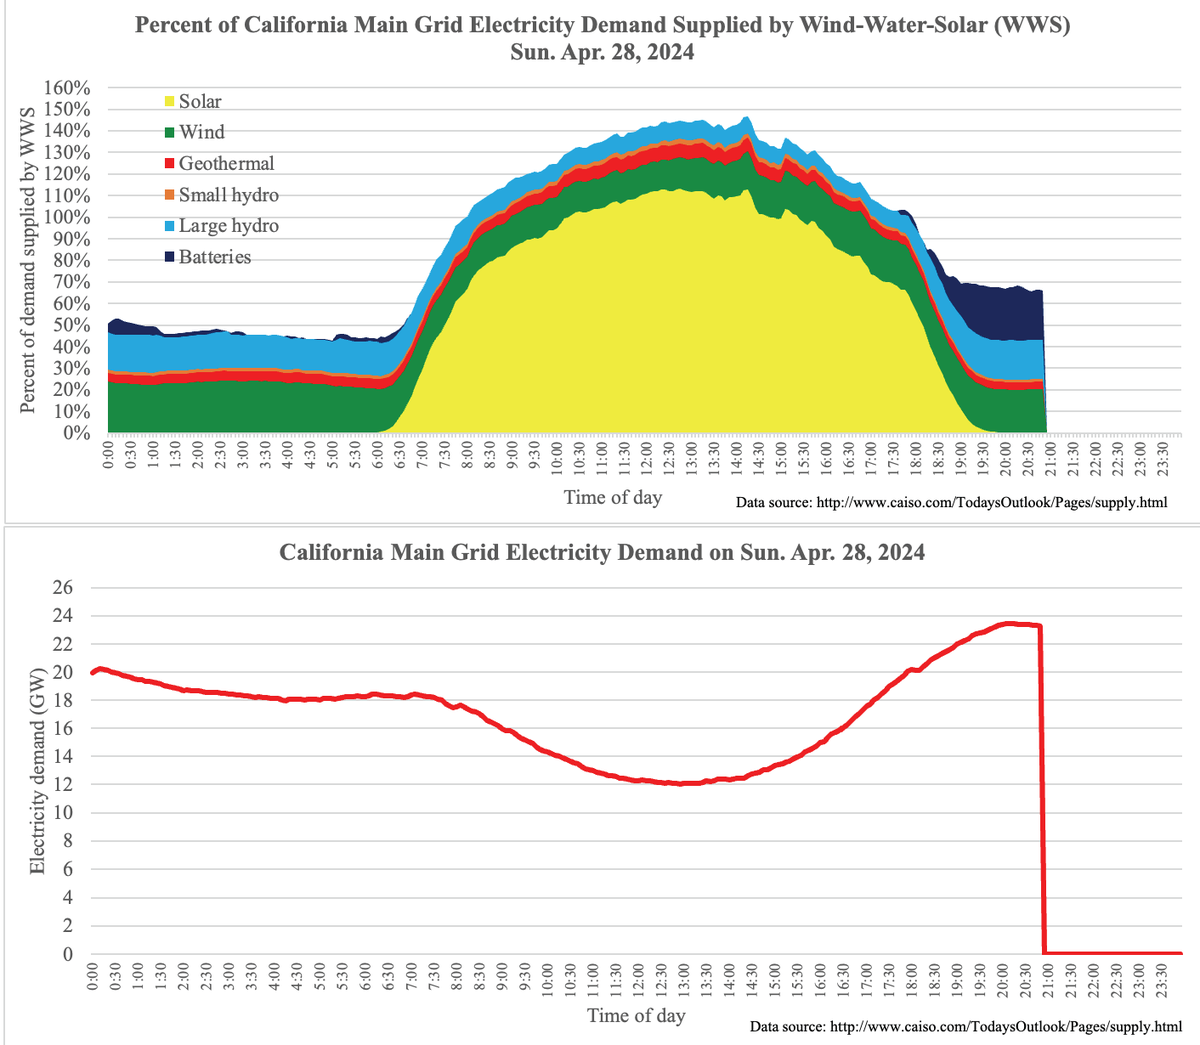
Records are made to be broken.

Today, Sun Apr. 28, supply exceeded California demand for 9.92 h (8 AM-5:55 PM), breaking yesterday's record of 9.75 h.

Today's peak: 146.7% WWS

15th day in a row and 44th out of 52 days WWS has exceeded demand for part of day
Records are made to be broken. 

Today, Sun Apr. 28, #WindWaterSolar supply exceeded California demand for 9.92 h (8 AM-5:55 PM), breaking yesterday's record of 9.75 h.

Today's peak: 146.7% WWS

15th day in a row and 44th out of 52 days WWS has exceeded demand for part of day
account_circle
Mark Z. Jacobson(@mzjacobson) 's Twitter Profile Photo

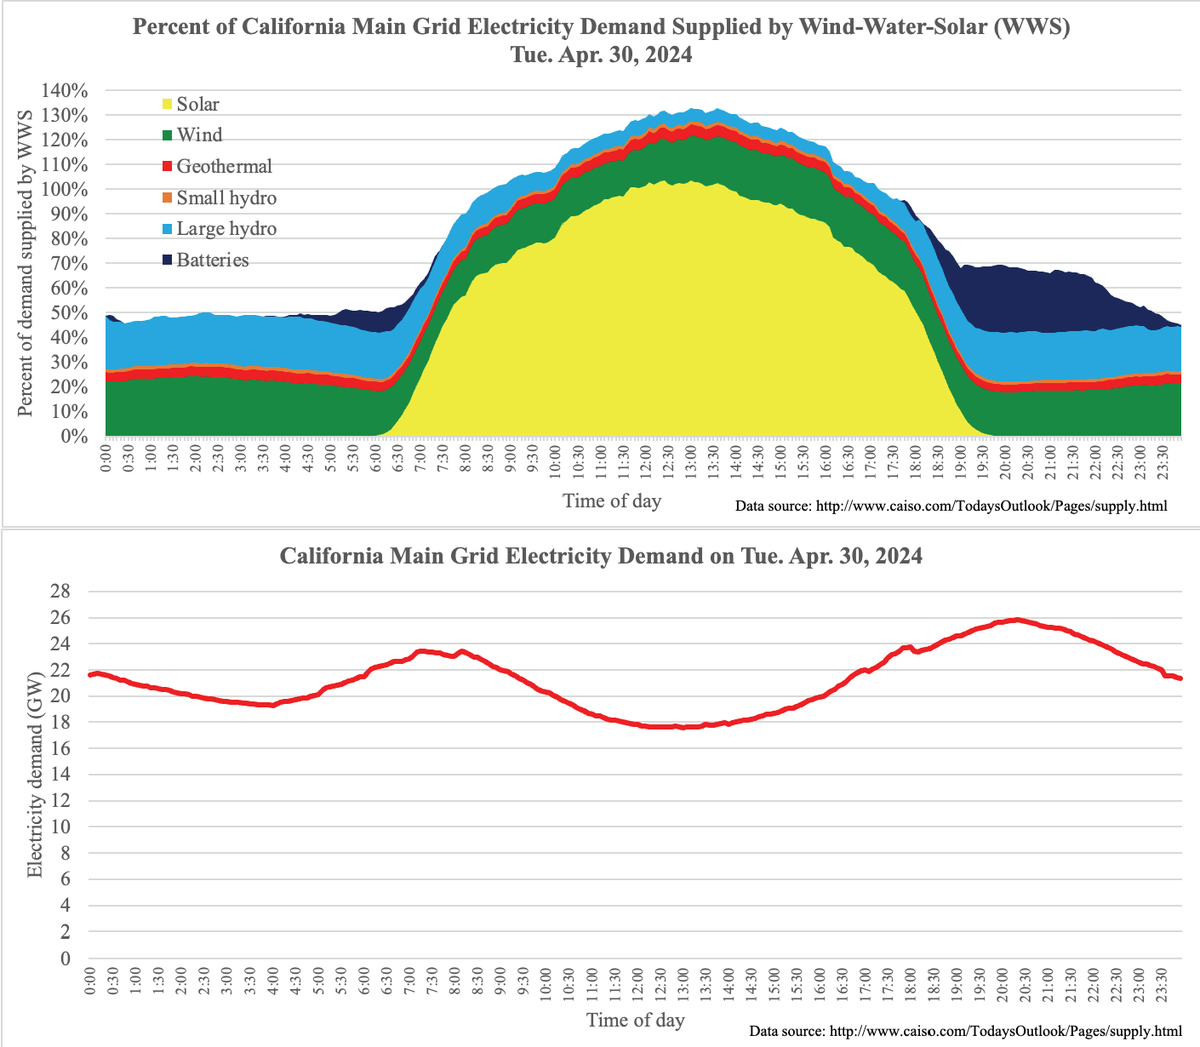
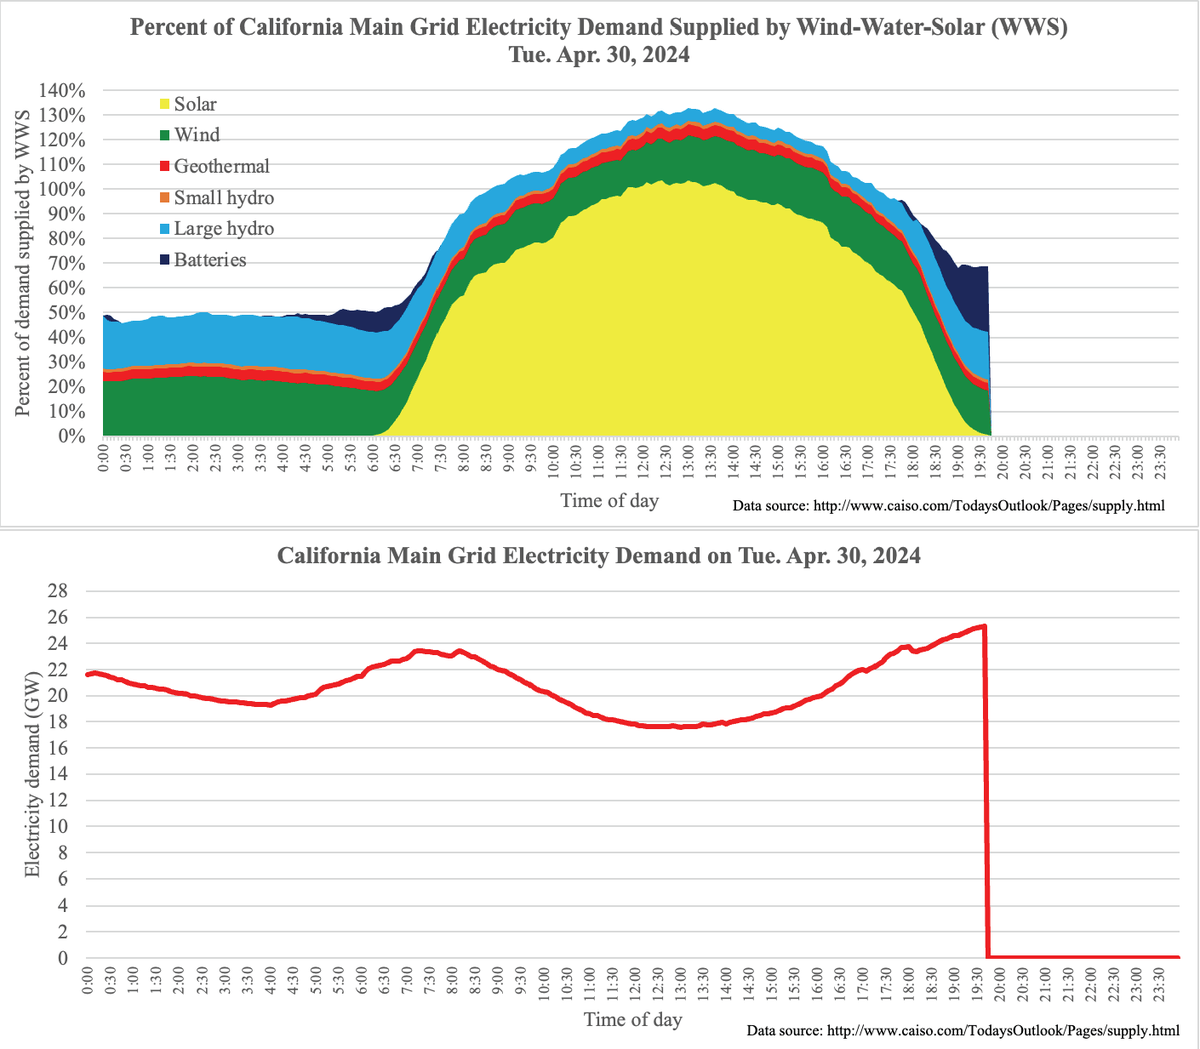
Another new record yesterday (Tue Apr. 30)

Batteries provided 4.83% of California's electricity output in the 24-h average (prev record 4.62%), which means they provided ~10% of all nighttime electricity, shifting it from the excess daytime generation.

Another new record yesterday (Tue Apr. 30)

Batteries provided 4.83% of California's electricity output in the 24-h average (prev record 4.62%), which means they provided ~10% of all nighttime electricity, shifting it from the excess daytime #WindWaterSolar generation.
account_circle
Mark Z. Jacobson(@mzjacobson) 's Twitter Profile Photo

Batteries supplied 3.4% of ALL California electricity consumed past 48 days

During 40 of the days, met >100% of demand 0.25-9.25 h/day, with max=148.3% of demand

Avg supply over all 48 days/nights: 60% of demand

Avg of 3.4 h/day > 100% WWS over all 48 days

Batteries supplied 3.4% of ALL California electricity consumed past 48 days

During 40 of the days, #WindWaterSolar met >100% of demand 0.25-9.25 h/day, with max=148.3% of demand

Avg #WWS supply over all 48 days/nights: 60% of demand

Avg of 3.4 h/day > 100% WWS over all 48 days
account_circle
Mark Z. Jacobson(@mzjacobson) 's Twitter Profile Photo

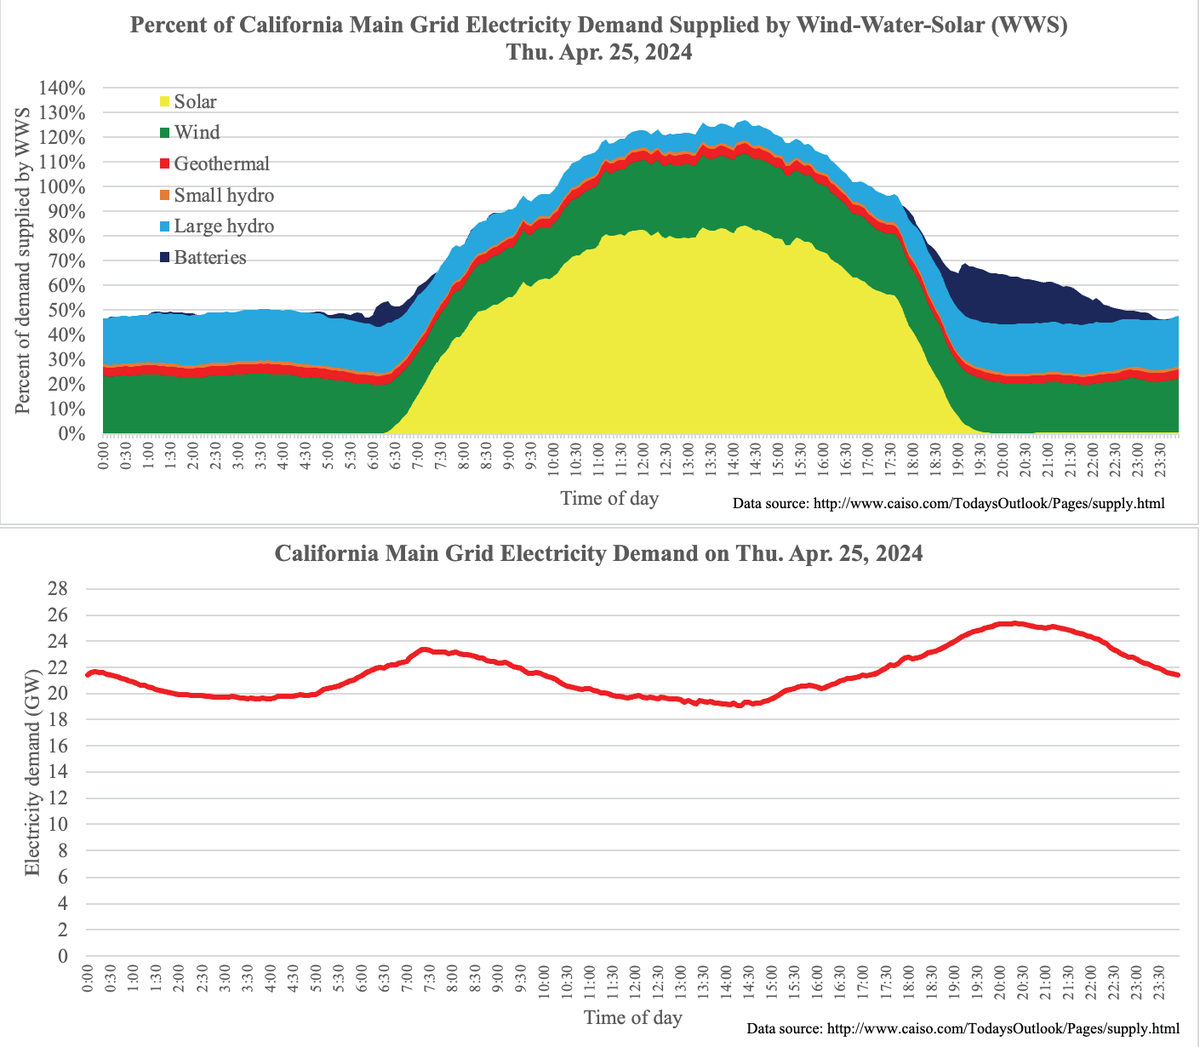
New record: 12th day in a row (on Thu, Apr 25) California supplied >100% of its demand with (and 41st of 49 last 49 days).

Peak: 127%
Hours >100%: 6.92
Minimum 46.2%
Avg: 74.9%

New record: 12th day in a row (on Thu, Apr 25) California supplied >100% of its demand with #WindWaterSolar (and 41st of 49 last 49 days).

Peak: 127%
Hours >100%: 6.92
Minimum 46.2%
Avg: 74.9%
account_circle
Mark Z. Jacobson(@mzjacobson) 's Twitter Profile Photo

More sun, wind, and water Fri Apr. 26.

For the 42nd of the past 50 days and the 13th day in a row, exceeded demand for 0.25-9.25 h/day. Yesterday, it was for 6.6 h

Minimum day or night was 47.6%, the highest minimum ever. Max was 128.5%. Average was 74.4%

More sun, wind, and water Fri Apr. 26.

For the 42nd of the past 50 days and the 13th day in a row, #WindWaterSolar exceeded demand for 0.25-9.25 h/day. Yesterday, it was for 6.6 h

Minimum #WWS day or night was 47.6%, the highest minimum ever. Max was 128.5%. Average was 74.4%
account_circle
Mark Z. Jacobson(@mzjacobson) 's Twitter Profile Photo

Solar is now being installed faster than any technology in history

Cumulative capacity now ~1.4 TW, a tenfold increase in 10 years. May rise to 9 TW in 2031

In 2023, comprised 82% of global electricity capacity additions

reneweconomy.com.au/solar-is-now-b… Renew Economy

account_circle
Mark Z. Jacobson(@mzjacobson) 's Twitter Profile Photo

This Tuesday, April 23, met a peak of 122.16% of demand on the grid and exceeded 100% of demand for 7.67 hours.

This was the 39th of the last 47 days during winter and spring that supply exceeded demand.

This Tuesday, April 23, #WindWaterSolar met a peak of 122.16% of demand on the grid and exceeded 100% of demand for 7.67 hours.

This was the 39th of the last 47 days during winter and spring that #WWS supply exceeded demand.
account_circle
Mark Z. Jacobson(@mzjacobson) 's Twitter Profile Photo

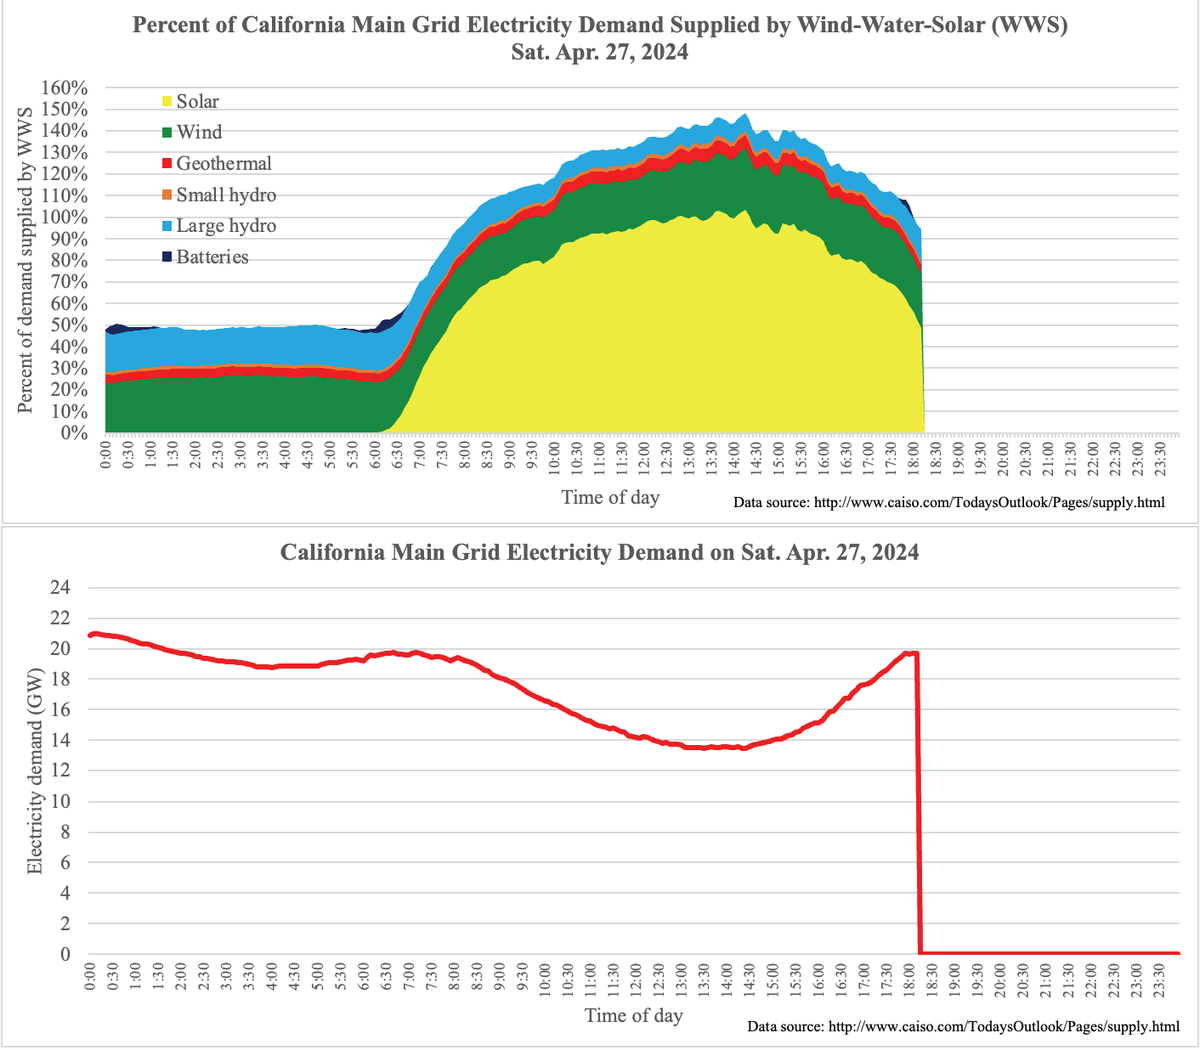
What is even more amazing about Saturday, Apr. 27?

In the 24-hour average, supplied 83.5% of California's electricity demand

This is the largest 24-hour average WWS to date.
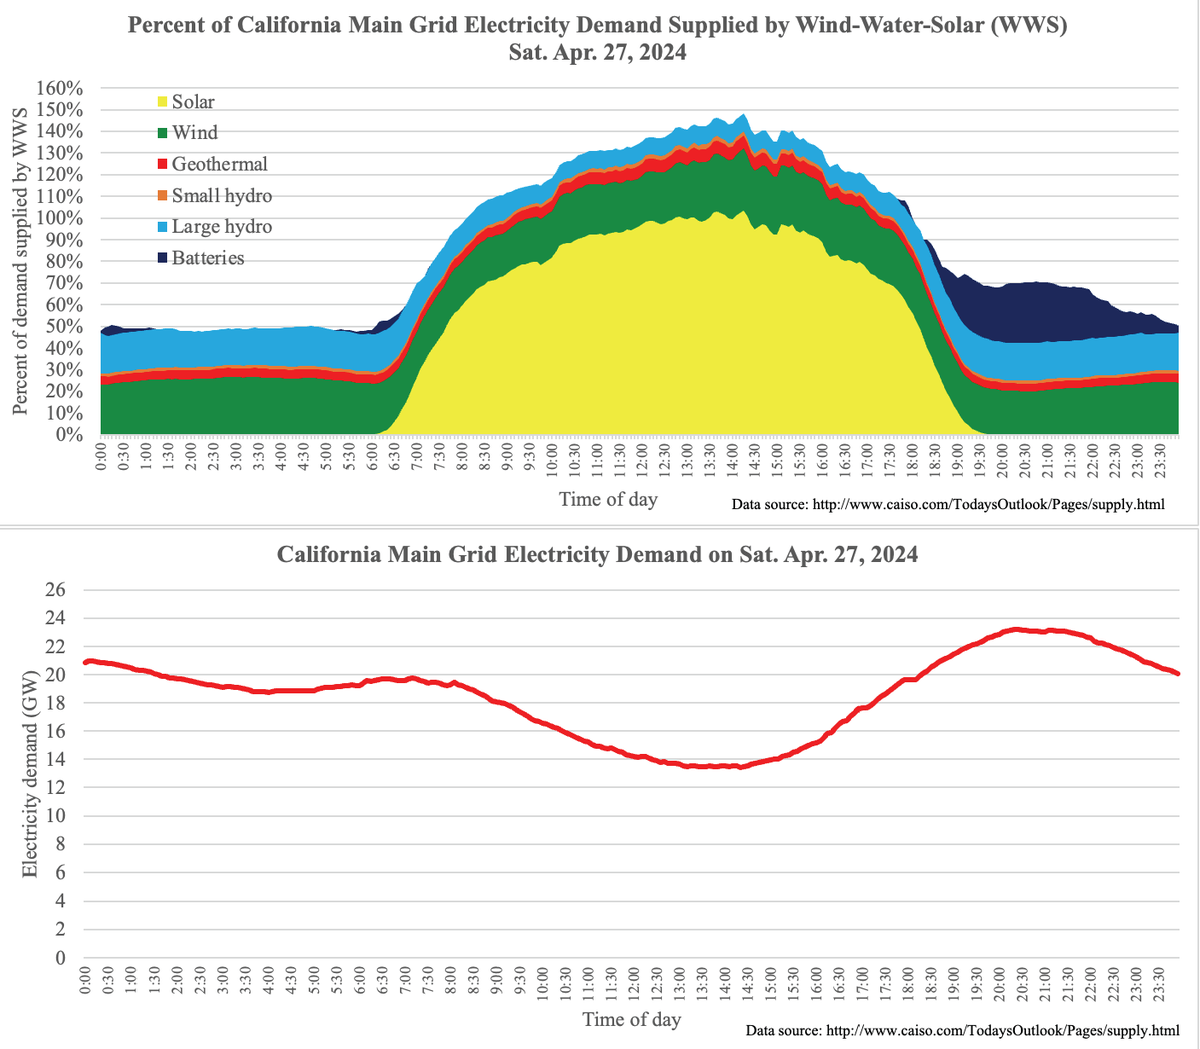
What is even more amazing about Saturday, Apr. 27?

In the 24-hour average, #WIndWaterSolar supplied 83.5% of California's electricity demand 

This is the largest 24-hour average WWS to date.
account_circle
Mark Z. Jacobson(@mzjacobson) 's Twitter Profile Photo

Another record falls.

For 9.75 hours today (Sat Apr. 27), California supply exceeded demand (previous record was 9.25 hours).

Peak today: 148.3%.

Even nighttime last night was 50% .

When will naysayers stop pretending 24/7/365 is not possible?

Another record falls.

For 9.75 hours today (Sat Apr. 27), California #WindWaterSolar supply exceeded demand (previous record was 9.25 hours).

Peak today: 148.3%.

Even nighttime last night was 50% #WWS.

When will naysayers stop pretending 24/7/365 is not possible?
account_circle
Rosario Ayela(@CharoAyela) 's Twitter Profile Photo

Mark Z. Jacobson That´s it! Yesterday there was another record, and April closes with almost a 100% WindWaterSolar day! We´ll never ever reverse, and renewable energy will be the new source that will push mankind forward, and that will pave the way for another incredible breakthroughs!

account_circle
Jodell.wb(@JodellWb) 's Twitter Profile Photo

What solves the fastest?

✳️The action you do, next

Look at GHG data in MN
MnPCA
CO2e 📉22% from 2007-2020

1 Move ⬆️🚌🔌🚶🏽‍♂️🚴🏿‍♂️🔌
⬇️⛽️

2 Eat ⬆️🥜🌰🫛🫘
Less ⬇️🥩🌴🪓🐂

3 triple 3️⃣x 🌞💨🌊🔌renewables

Mark Z. Jacobson

4 follow Project Drawdown & International Energy Agency

What solves #Climate the fastest? 

✳️The action you do, next

Look at GHG data in MN
MnPCA
CO2e 📉22% from 2007-2020

1 Move ⬆️🚌🔌🚶🏽‍♂️🚴🏿‍♂️🔌
⬇️⛽️

2 Eat ⬆️🥜🌰🫛🫘
Less ⬇️🥩🌴🪓🐂

3 triple 3️⃣x 🌞💨🌊🔌renewables
#WindWaterSolar
@mzjacobson 

4 follow @ProjectDrawdown & @IEA
account_circle
Jodell.wb(@JodellWb) 's Twitter Profile Photo

25 Million tons of CO2e emitted in Minnesota ✔️by making Electricity

add more power 🌞💨🌊🔌Faster!

We need to cut 25 Mt to 0 Zero Mt.

❌methane or ❌coal

$15/Gw 🌞💨🔌🔋

$35/ to $144 🔥🔌methane
$65/ 🔥🔌coal
$129/ ☢️🔌
Base prices 2022 US Dept of Energy
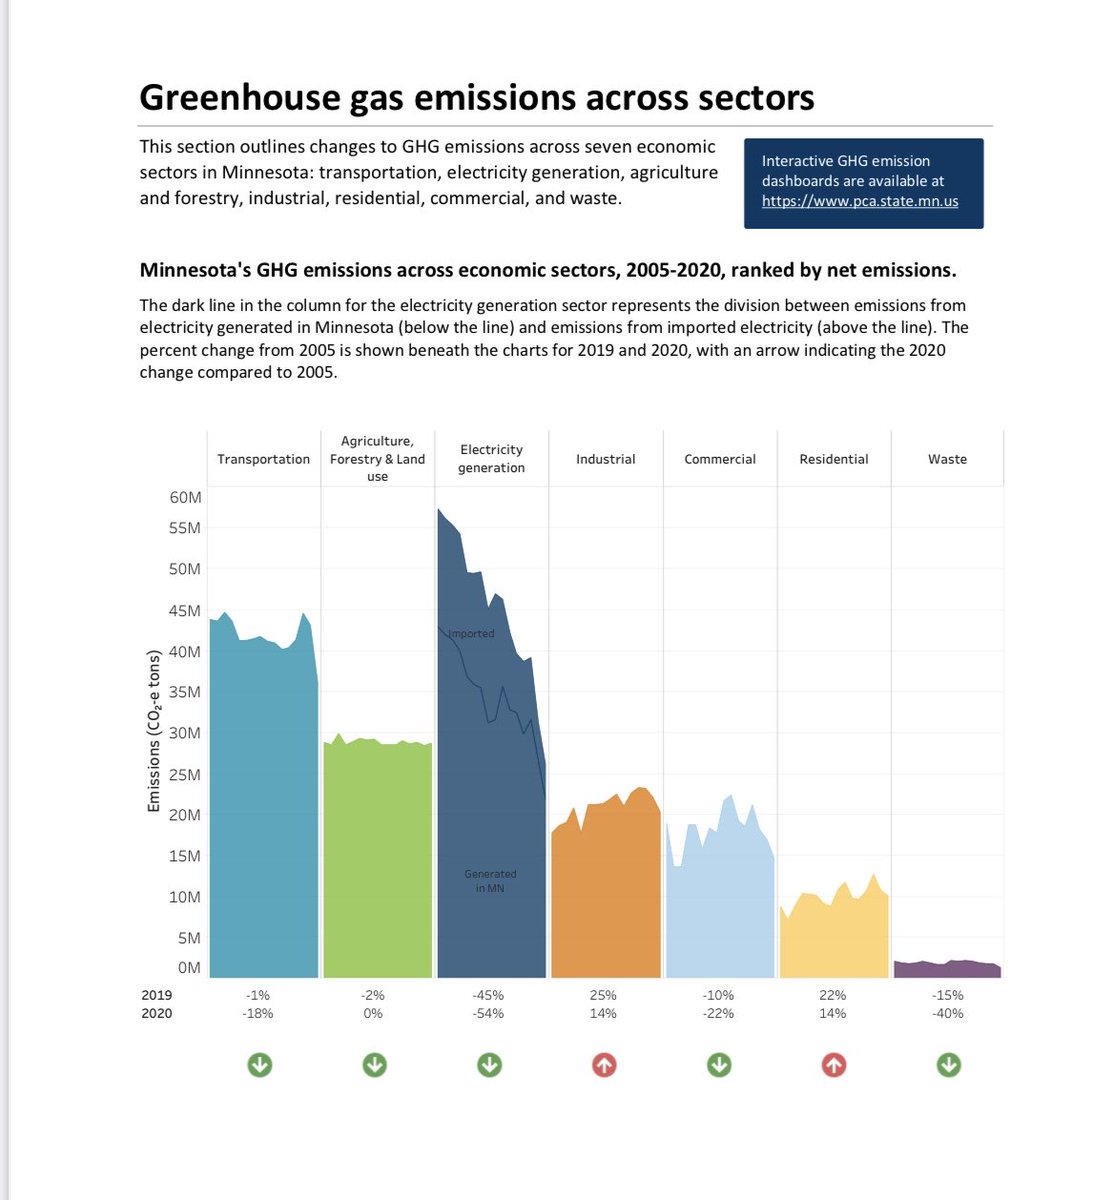
25 Million tons of CO2e emitted in Minnesota ✔️by making Electricity 

add more #WindWaterSolar power 🌞💨🌊🔌Faster!

We need to cut 25 Mt to 0 Zero Mt.

 ❌methane or ❌coal

$15/Gw 🌞💨🔌🔋

$35/ to $144 🔥🔌methane 
$65/ 🔥🔌coal 
$129/ ☢️🔌
Base prices 2022 US Dept of Energy
account_circle
Dardedar(@Dardedar) 's Twitter Profile Photo

Brian Gitt Every day, a new record
22 of last 27 days, CA's supply exceeded demand 0.25-6 h/day
10 of the 11 states with above 50% renewable, are among THE lowest-cost-electricity states.
x.com/mzjacobson/sta…
account_circle